Updated:October 14, 2026

17 min
17 min

What do you know about the most powerful patterns in the market? This article will help you to recognize and make money with them. Welcome to the empire of the continuation patterns: Flag and Pennant.

Author
Flags symbolize the continuation of a nation and a country, and they portray the future of their people in colors. To keep the nation’s flags strong and help their citizens fulfill their aspirations, many soldiers fight for the flags of their countries. Many people got killed, but never forget that the flag never falls.
But flags are not just for countries; they can also be in markets; have you ever noticed a flag among the candles in a market? You should know that the market is full of different flags, which is the trends’ identity. The patterns in which the flag is raised are still present and are strongly sustaining themselves.
Do you know why we call it the flag? Because it is like a flag. The flag is made of fabric and has a pole. In the market, the flag pattern develops following a trend with solid momentum, and then a corrective movement takes the form of the flag’s fabric.
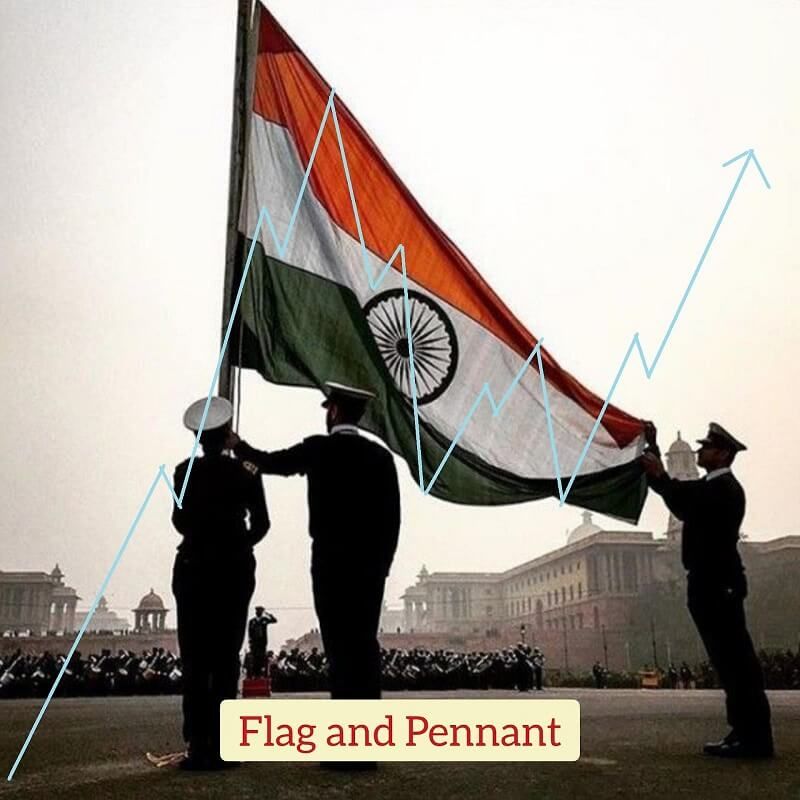
Many traders and organizations fight for these flags to keep them standing and reaching their goals. I’ll introduce you to various flag designs in this way.
This journey aims to familiarize the reader with the flag and pennant pattern, and you will discover their function, strength, shape, and design. Never forget to honor your flag.
In upward trends, flag, and pennant patterns form in the middle of the movement, and the price keeps moving in the same direction. Flag and pennant are two of the most essential continuation patterns, and they occur a lot in the chart.
Learning these two patterns is mandatory. So try to read this article entirely and practice.
We first need an upward trend with a strong momentum before we can form the flag and pennant. This upward trend plays the role of a flagpole. The flag pole shouldn’t have significant pivots, and increasing price momentum while creating the flag pole increases the pattern’s credibility.
Some traders believe that the occurrence of a major pivot in the flagpole is normal and that it has no bearing on the pattern’s validity. But my advice is not to accept their words because the presence of a major pivot in the middle of the pole reduces pattern validity. Forming the minor pivots in the flagpole is normal. In the future, I’ll go into detail about major and minor pivots.
After the upward trend, there is a period of correction or consolidation. Those who couldn’t buy at lower prices can buy at this reasonable price. Because at this price, sellers enter the market.
The correction should be between 23.6% and 38.2% (Fibonacci levels) of the flag’s overall size to achieve the best credit in the correction phase of the pattern. Larger or smaller sizes are permitted, but the pattern’s validity will be compromised.
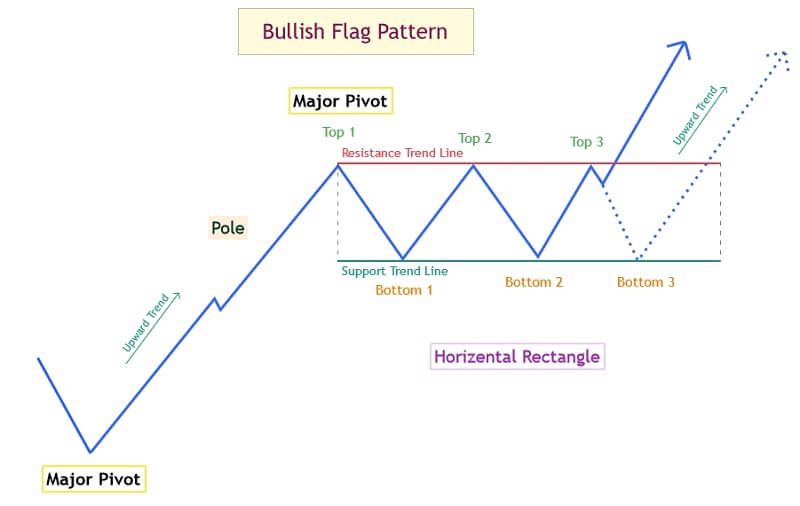
The Correction zone forms several types, and a price channel represents the first kind. In this instance, the price moves into a price channel and becomes trapped between the support and resistance trend lines, two parallel lines.
To increase the pattern’s validity, the correction should be at a downward trend with a slope against the primary price trend. The correction can occasionally take the shape of a horizontal rectangle.
Bullish flag corrections can occur in trends with the same direction slope as the primary trend. Please avoid taking chances with these flags, as this mode has less validity. There is another type of flag called the pennant.
Unlike the rectangle, the pennant has three corners and forms a triangle. This triangle can form a symmetrical pattern, but there are some differences between the Pennant and the symmetrical triangle.
The main difference is that in the pennant pattern, we have two major pivots, the top 1 is one of these pivots, and the other is at the beginning of the pole. The rest of the pivots that lead to the formation of the pennant flag are minor.
But in the symmetrical triangle pattern, all the tops and bottoms are major pivots. And we pay less attention to the momentum that forms before the symmetrical triangle pattern.
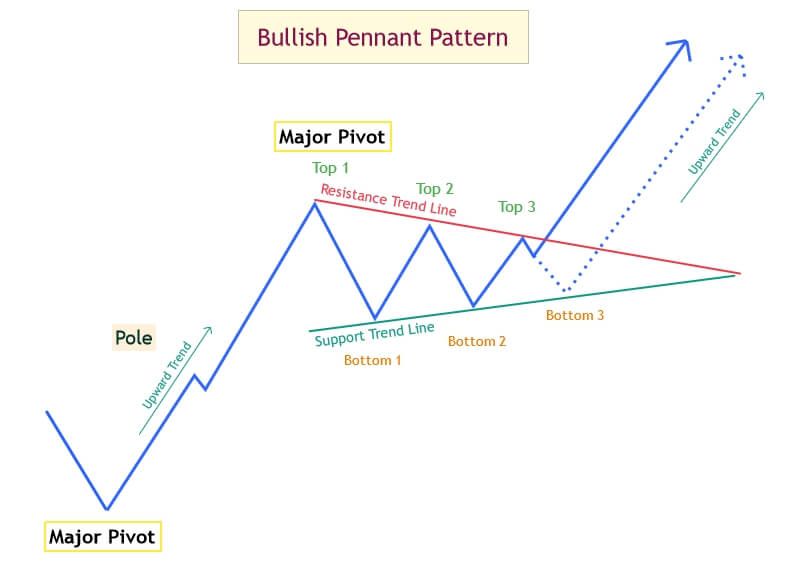
We need three to five minor pivots to form a correction in the pennant or flag pattern. The validity of the pattern decreases if there are more than six minor pivots. In total, we need 5 to 7 pivots to form a flag pattern,
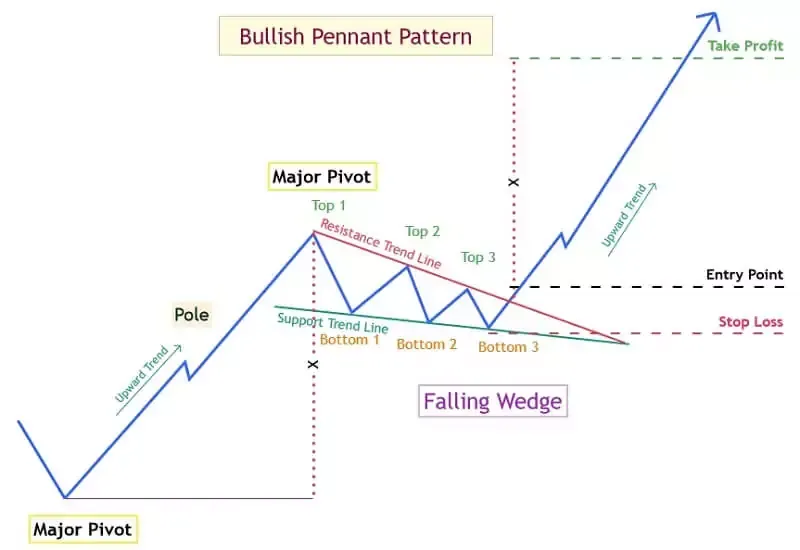
But the pennant sometimes has a downward slope; there are two converging lines, the support trendline and the resistance trendline, with a negative slope in the consolidation phase.
In this instance, a falling wedge forms a reversal pattern; it ends in the consolidation phase, so the price resumes its prior upward trend and rises sharply.
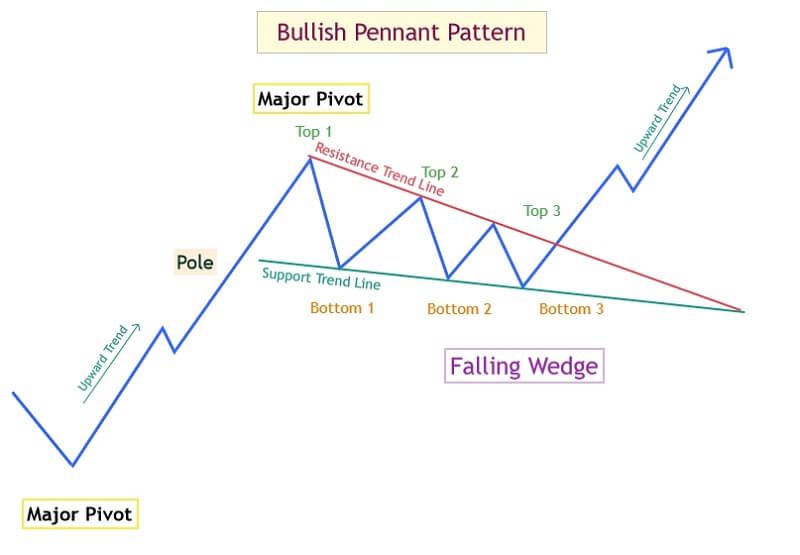
If you recall the wedge discussion, I mentioned that falling wedges could occur during consolidations and act as a continuation pattern. The time has come. The consolidation phase in this scenario must include at least one major pivot and five minor pivots.
These three scenarios, which include the rectangular shape, symmetrical triangle, and falling wedge, can occur in the consolidation section and significantly increase the validity of the pattern.
The volume of the market is very high in the formation of the flagpole. Then the volume decreases in the correction zone until the price wants to break the flag and rise. The market volume will increase again at the breakout and raise the price.
Flag and pennant patterns are prevalent in one-sided markets like Stock and two-sided markets like Cryptocurrency and Forex because traders can place long positions in these two markets.
Trade on the Bullish Flag and Pennant pattern
After breaking the resistance trend line in the correction zone, the price gives the signal to enter the market. It’s better if a valid candle breaks the trend line and closes above it.
You can start trading after the breakout candle and set your stop loss below the last bottom. You can place the stop loss below the breakout candle or below the last minor pivot before breaking the trendline to receive a higher risk-to-reward ratio in your position.
However, what is the size of the take profit? Flag and pennant patterns typically increase the price by an amount equal to their previous uptrend or the same flagpole after failing. So the take profit is equal to the size of the flagpole.
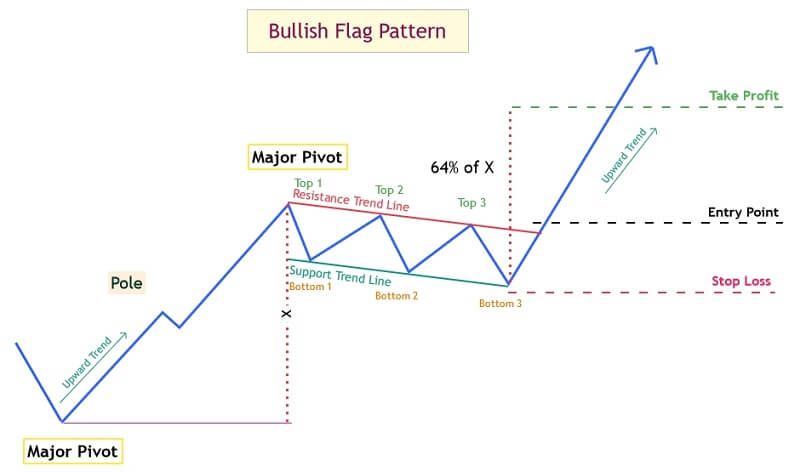
You can determine the take profit by calculating this size starting from the resistance trend line’s breaking point. Some traders calculate this size or X from the last bottom in the correction zone for the take profit. But the first method generates more profit; I advise using it; you can select any approach, depending on how you manage your capital.
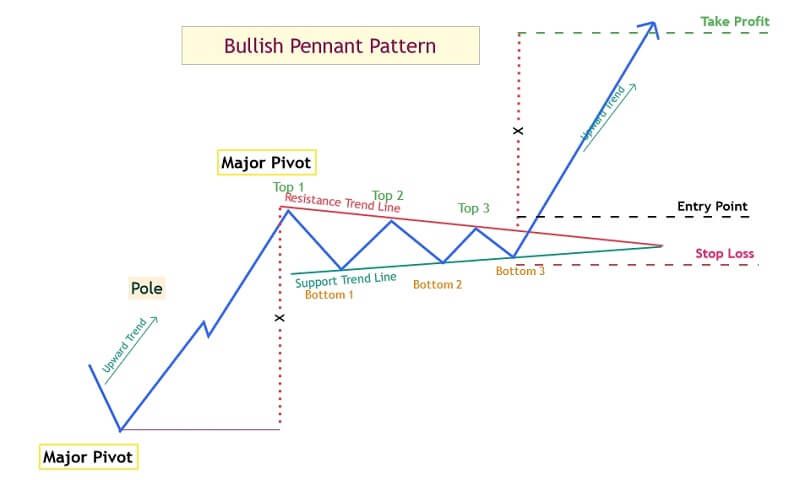
Flag and Pennant patterns are attractive due to the high take profit rate and low stop loss. After the formation of the flag pattern, the price usually rises with a lot of momentum. Remember to protect this flag and fight for it. In the photo below, you can see the bullish pennant, whose correction shape is similar to the falling wedge, which follows the same rule:
The take profit is lower for the weak and uncommon flag and pennant patterns. For example, for flags and pennants whose consolidation zone is ascending triangles, expanding triangles, and broadening Wedges, you can choose the distance between the highest top and the lowest bottom in the correction zone for the take profit.
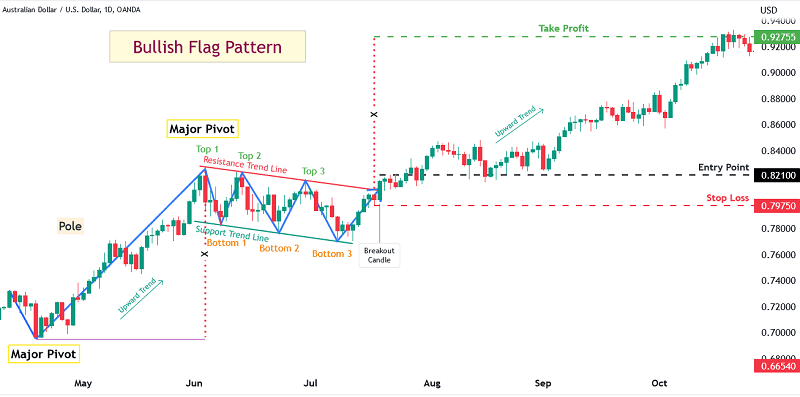
I developed this unique method over many years of trading and experience. I hope you will use it and increase your profits. If you are analyzing time frames higher than daily and weekly, it is better to look at the chart in logarithmic form so that the target and pattern sizes are more realistic. Please watch my long position on the AUDUSD chart in the daily time frame.
 '
'
After forming the flag pattern, I waited for the break of the resistance trend line to enter a long position. The price broke the resistance line with a breakout candle, so I entered a long position above the breakout candle at 0.82100 USD, and my take profit was equal to the size of the flagpole, and I put it at 0.92755 USD.
I placed my stop loss below the breakout candle at 0.79750 USD. I made almost $8,000 in profit in this position, while my stop loss was $1,700. The flag can make you rich.
The flag and pennant patterns form downward trends frequently, and as a continuing pattern, they take the price to the abyss and fall. If you pay attention to the downward trends, you will see the flag and pennant because they are repeated a lot in the chart.
Flags and pennants have high credibility, and they guarantee your profit.
We first need a downtrend with high momentum to form a bearish flag and bearish pennant in a descending trend. The trend should not have major pivots to get a high score, and the price should fall like a pole. That’s why we call it the flagpole. The validity of the pattern increases as the flagpole momentum increases.
Some traders are not sensitive about this issue and credit the pattern if major pivots form in the flagpole. But don’t do this because the probability of failure is very high in this situation.
After this downward trend, which we know as the flagpole, the price enters the correction phase. It is reasonable to enter the market as a seller (open short positions) at this level.
The size of the correction phase should be 23.6% to 38.2% (Fibonacci levels) of the size of the flagpole in the best case. Smaller or larger sizes than this value are also allowed, but it reduces the validity of the pattern.
The shape of the correction zone can be in several ways. The first type is a price channel. In this case, after a downward period, the price enters a price channel with two parallel lines, the support trend line, and the resistance trend line. For more credibility, it is better if the slope of this price channel is opposite to the primary trend, i.e., a positive slope.
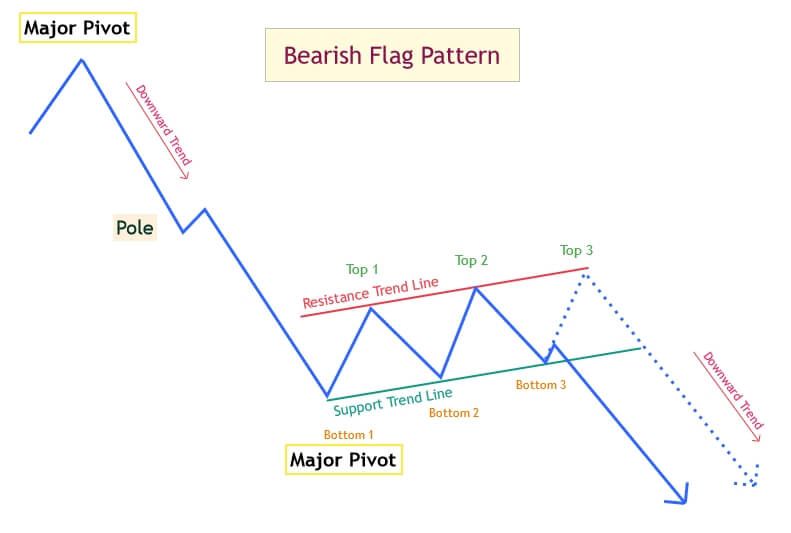
Of course, it can be a horizontal channel that forms a rectangular pattern.
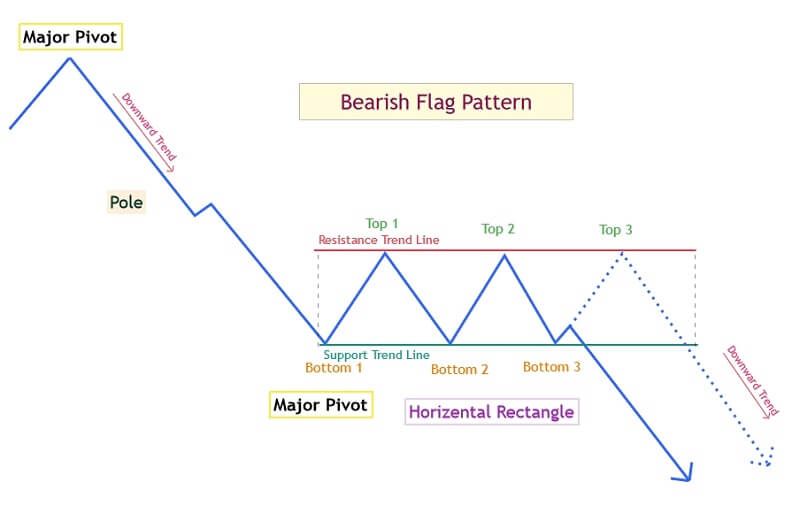
Corrections with slopes that are in the same direction as the slope of the main trend are less valid. For instance, in a downward trend, the validity of the correction phase with a negative slope reduces.
There is another type of flag in downtrends called the pennant**.** Unlike the rectangle, the pennant has three corners and forms a triangle.
Sometimes a pennant is just a correction in a neutral trend, which has a shape similar to a symmetrical pattern. So a resistance trend line with a negative slope forms at the top, and a support trend line with a positive slope at the bottom of the correction. But there are differences between the symmetrical pattern and the pennant.
One of the most important differences is the presence of a major pivot outside these two lines, which forms at the beginning of the flagpole.
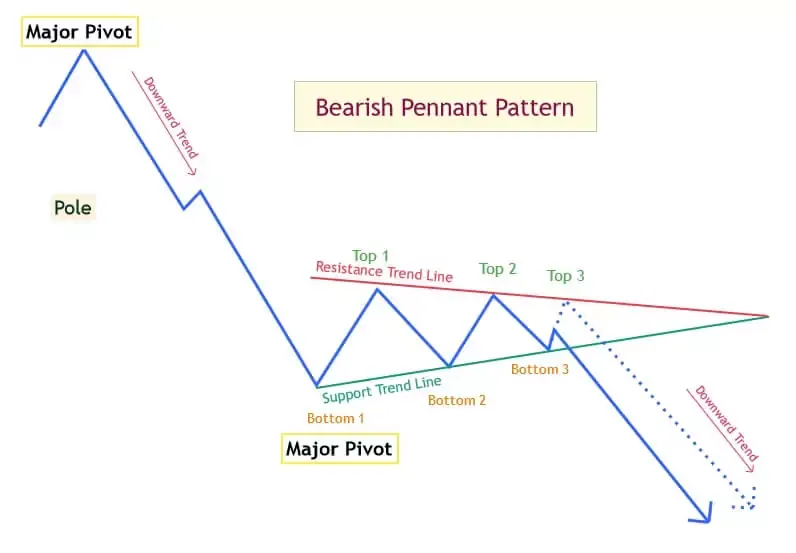
To form this type of pennant and flag, we need two major pivots and three to five minor pivots. If the number of pivots is more than 5, the validity of the pattern reduces. To create a flag pattern, we require five to seven pivots overall.
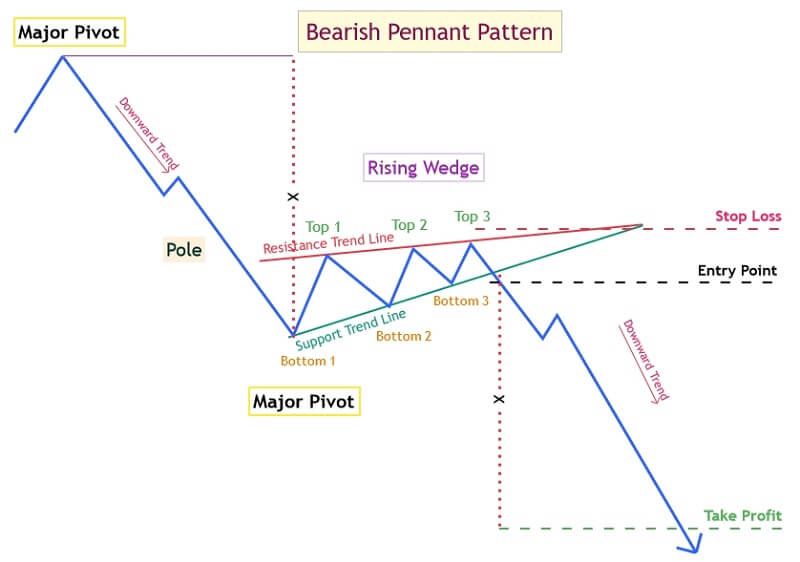
But the pennant sometimes takes a positive slope, and the form of a rising wedge, and this situation is widespread in the market. This rising wedge ends the correction and turns the trend back into a downward trend.
The correction phase must consist of one major pivot and five minor pivots. After forming six pivots in the correction zone, the pennant pattern completes.
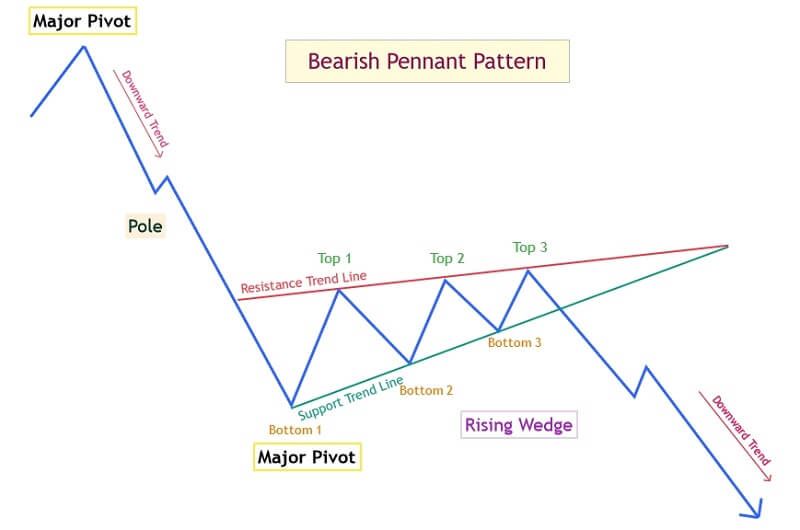
Flag and pennant patterns have a lot of fans in two-sided markets like Cryptocurrency and Forex because traders can place short positions in these markets. Flags and pennants in one-sided markets like stocks can be a signal to determine the price direction.
The volume of the market is very high in the formation of the flagpole. Then, in the construction of the correction zone, the volume decreases until the price wants to break the flag and fall. At the time of the breakout, the volume of the market increases again.
Trade on the Bearish Flag and Bearish Pennant

After forming flag and pennant patterns, a small signal is enough to ensure that we can enter the short position. If the price breaks the support trend line with a true breakout, we can enter a short position after the breakout candle.
A valid breakout candle can be a good sign for the tendency to continue. You can place the stop loss above the last top. Of course, there are other ways that you can use them. For example, set the stop loss above the breakout candle. Or, if you have a minor pivot before the breakout, place it on top of the minor pivot.
The price usually goes down to the size of the flagpole. So the take profit is the same size as the flagpole. To determine the take profit, please calculate this size from the breaking point; some traders calculate this size or X from the last top of the correction.
But I recommend the first method because it increases your profit. You can change it according to your capital management.
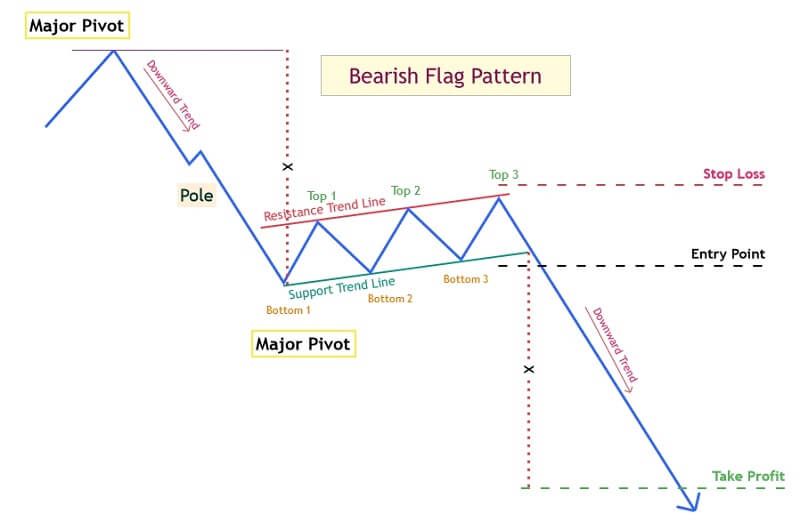
We do the same for bearish pennant:
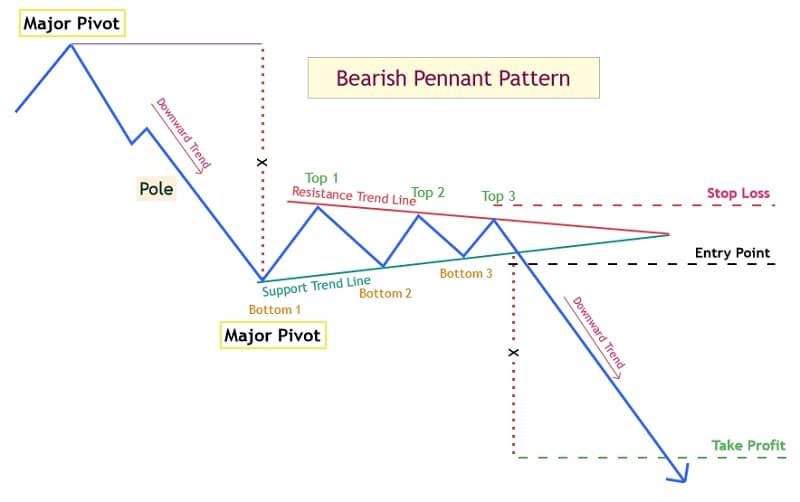
In the photo below, you can see the bearish pennant, whose correction shape is similar to the rising wedge, which follows the same rule:
In the case of trading in daily and weekly time frames, it is better to look at the chart logarithmic so that the target and the pattern size can be more realistic. There is one of my trades on the BTCUSDT chart in the 5-minute frame.
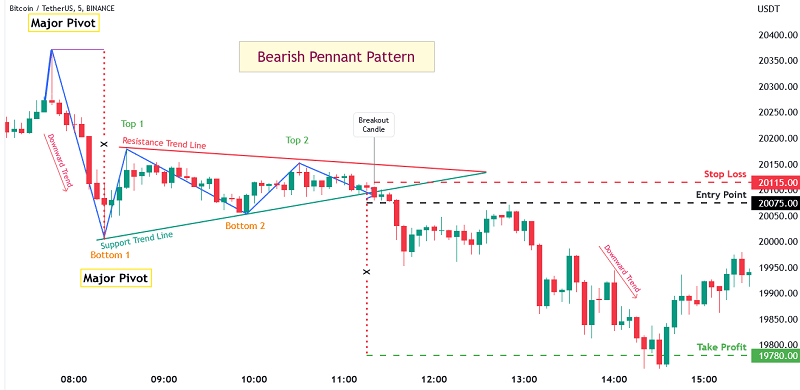
After the formation of the pennant pattern, I waited for the breakout of the support trend line to enter a short position. The price broke the support trend line with a breakout candle, and after closing the candle below the support trend line, I entered a short position at 20075.00 USDT and placed the stop loss above the breakout candle at 20115.00 USDT for a higher risk-to-reward.
My take profit was equal to the size of the flagpole, and I placed it at 19780.00 USDT; I made a profit of 6500 dollars in this position, an excellent position with the most substantial continuation pattern in the market.
The correction zones of the flag and pennant patterns have other modes that are less common in the market and have less credibility. But it is vital that you learn these methods to have a higher win rate.
So let’s learn this fascinating mode together to make our information about flags and pennants complete.
Sometimes the correction zone takes the form of an expanding triangle:
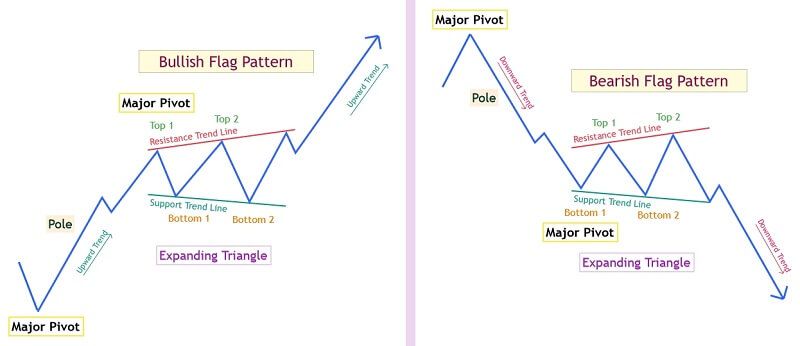
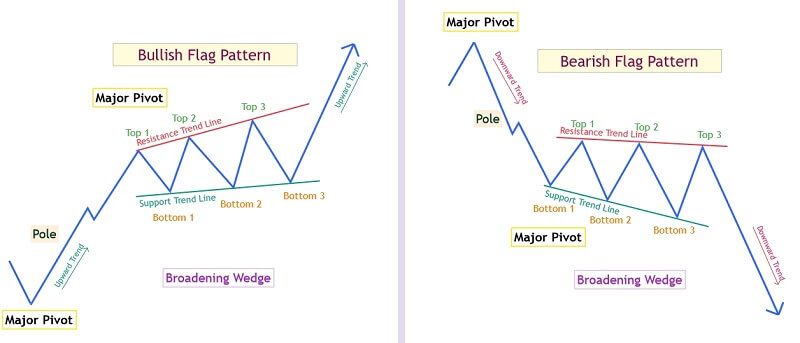
In some cases, the correction zone can be a broadening wedge:
In some cases, the correction zone takes the form of an ascending triangle or a descending triangle:
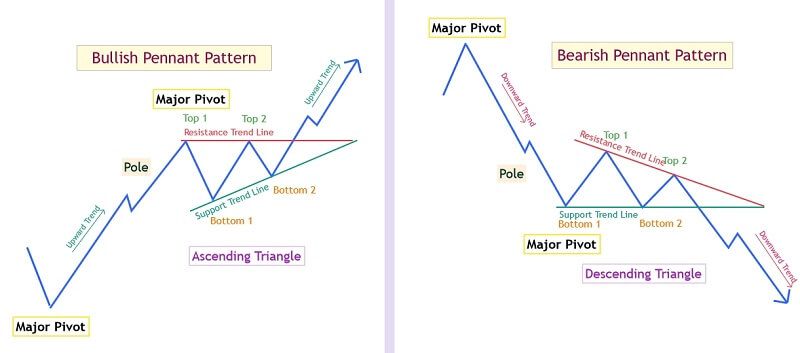
The take profit is lower for this kind of flag and pennant pattern. For example, for flags and pennants whose correction zone is like ascending and descending triangles, expanding triangles, and broadening Wedges, you can choose the distance between the highest top and the lowest bottom in the correction zone for the take profit.
It’s time for me to tell you more about figures and statistics. Numerous researchers have studied classical patterns; Kirkpatrick and Dahlquist produced intriguing findings in this area.
This research is the result of years of experience. So if you are a new trader, it is better to learn these parts to analyze like a professional.
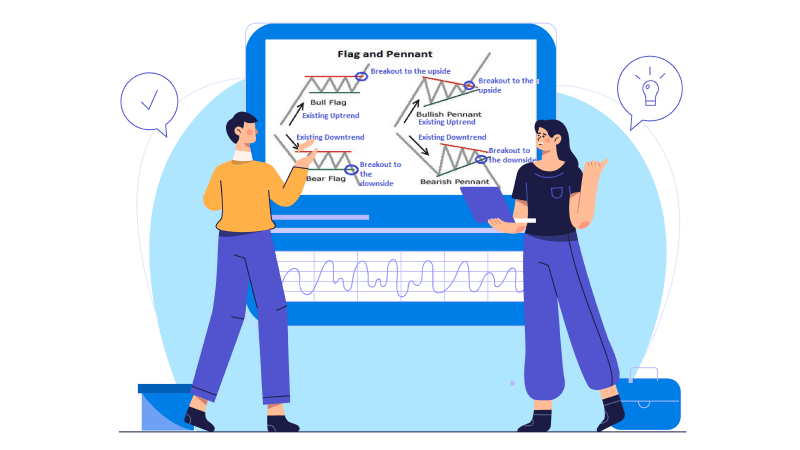
According to Kirkpatrick & Dahlquist, for the best result from the pattern and the most profit, it is better than the slope of the flagpole to be 45**°** positive in the upward trend and 45**°** negative in the downward direction.
The flags created after a pole with a change of 90% increase or decrease in the price are solid for the stock market. The target of these patterns is 69% of the flagpole size.
Bulkowski is one of the most outstanding researchers of classical patterns. He has reached the following conclusions about the flag and pennant you can use to increase your profit.
Bulkowski says that tight flags perform better than broad and irregular flags. That is, the smaller the flag correction is, the better it is. The correction’s slope should be against the main trend slope to have a valid pattern.
Bulkowski also reached these results for the target of flags and pennants. To have the best position with the least risk, the target of bullish flags should be 64% of the size of the flagpole; count it from the last bottom at the correction zone.
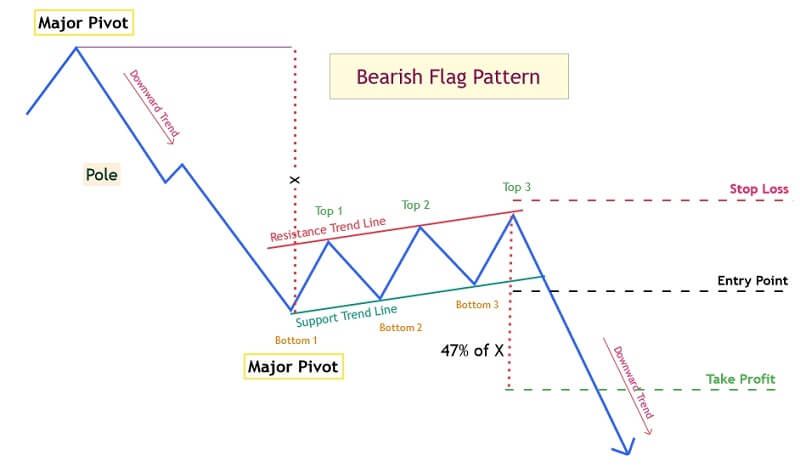
To have the best position with the least risk for the bearish flags, the target should be 47% of the size of the flagpole, and it is considered from the last top of the correction zone.
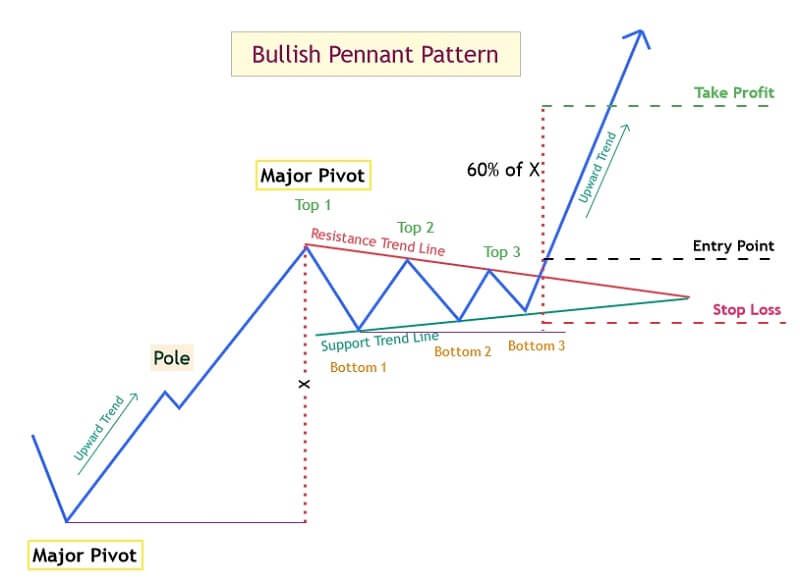
He also presented the same research for the pennant pattern. According to Bulkowski, for the best win rate, the target of bullish pennants should be 60% of the size of the flagpole; we count it from the lowest bottom of the correction zone.
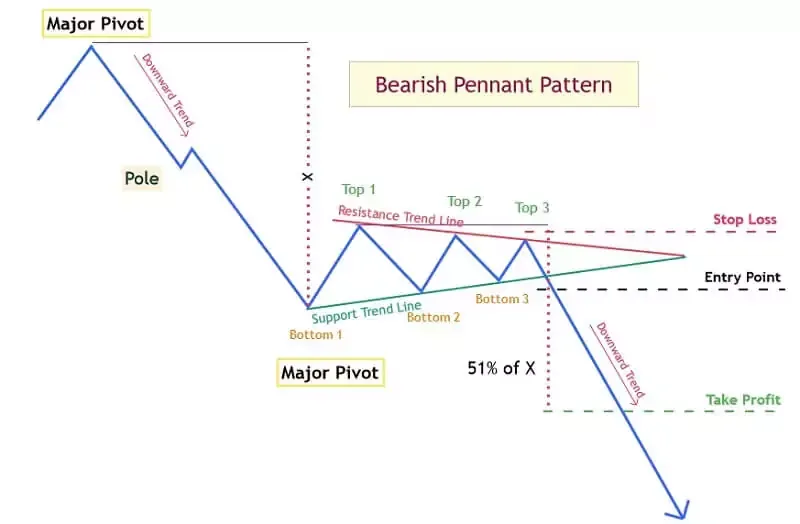
Also, in downward trends, to have the best position on the pattern, the target of the bearish pennant should be 51% of the size of the flagpole, and you count from the highest top of the correction zone.
The flag and pennant patterns are widely present in Elliott waves. These two patterns are two of the main patterns in Elliott waves, which form in correction waves.
I have benefited greatly by learning Eliot and combining it with Flag and Pennant. In this article, I will tell you what I know so that you can increase your profit.
The flag pattern is predominantly in Waves 2 and B, but in wave 4, we see it barely. To be more precise, I have to explain it like this:
The flag pattern occurs in waves 1 and 2, with three sub-waves. In this case, the whole wave1 is the flagpole, and the entire wave 2 is the correction zone of the flag. Usually, this type of flag reaches its target and is a great area to trade on.
Also, the flag pattern can be in waves A and B with three sub-waves. In this way, the whole of wave A is the flagpole, and the entire wave B is the correction zone of the flag. This type of pattern usually brings the price to its target.
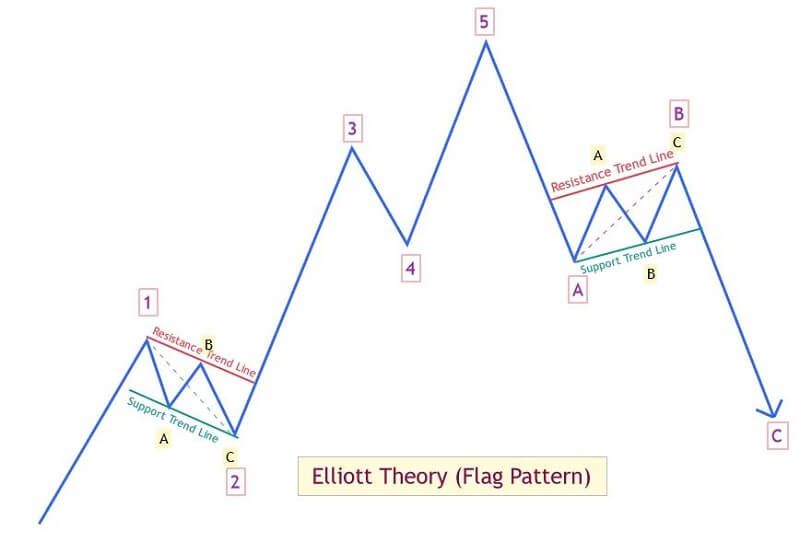
The pennant pattern can not be in waves 1 and 2. This pattern is most often in wave B and has five sub-waves. And in special conditions, it can form in wave 4. This pattern usually brings the price to its target. In this pattern, the entire wave A forms the pennant pole, and the entire wave B forms the correction area of the pennant.
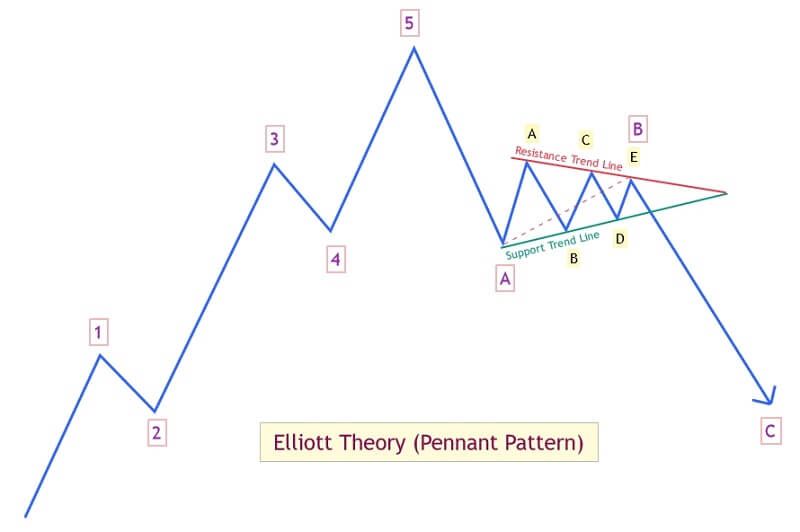
Of course, I spoke briefly about Elliott. Elliott’s theory is much more complex, and I will discuss it in the following articles.
I tried to teach you one of the best and strongest classic patterns. With this flag, you can conquer better positions and place your flag on the highest mountains made of profit.
Always respect the flag and Pennant because these patterns will benefit you wherever they appear in the chart and bring you a good profit. It is not enough to just read this article, you must repeat and practice it several times.
The pennant and flag are the same types, but their shape is different. Try to continue your success like these two patterns and live a happy and healthy life.
To be a successful trader, you need to follow capital management. Never close the position when it is in the profit zone because you will forfeit your profit. Try to float on the waves of profit and enjoy it to the end. Thank you very much for being with me. I wish you all the best.
Find Your Perfect Broker: Explore Our List Now!
Choose the best with our expert-selected options
Find Your Perfect Broker: Explore Our List Now!
Choose the best with our expert-selected options
Discover top binary options brokers tailored to your region. Browse our curated lists by country:
2258