Use a stock options calculator to maximize your profit potential?
Total cost
Expected change
Total return on option

WHAT IS A STOCK OPTION?
A stock option is a contract that allows you to purchase or sell, but not the obligation, a specified amount of a company’s stock at a specified price on or before a determined date. Stock options are frequently rewarded or incentivized for employees, executives, or shareholders.
For instance, if you work for ABC Inc., 1,000 stock options form a part of your 2018 bonus. You can buy or sell 1,000 shares of ABC stock at $50 per share, with the options’ strike price being $50. They also feature an expiration date (December 31, 2023), so you will have until this date to use them.
HOW DOES THE STOCK OPTIONS CALCULATOR WORK?
Stock Options Calculator is a tool that you can use to compute the worth of your stock options, considering variables like present stock price, strike price, total options granted, and expiration date. The calculator also allows you to compare various scenarios and strategies.
To use the stock options calculator, you need to enter some basic information about your stock options, such as:

Similarly, you can choose between call or put as per your choice. Once you enter the data, click the Calculate button to view the results.
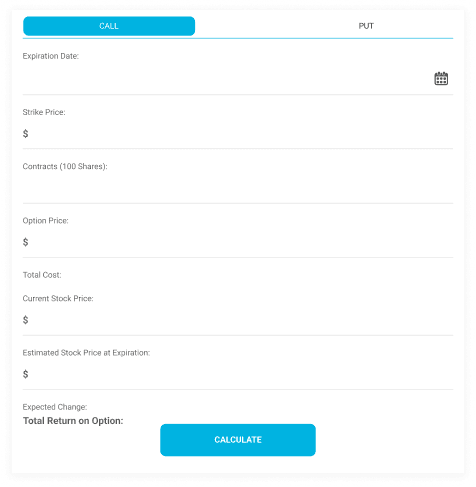
For example, suppose you want to use the stock options calculator to evaluate your ABC options. You enter the following data:
- The current stock price of ABC is $60.
- The strike price of the options is $50.
- The number of options you have is one contract (100 shares).
- The estimated price at expiry is $110.
- The expiration date of the options is December 31, 2023
You choose the option type “Call”. You click on the Calculate button and see the results. It shows a net gain of $1,000 using the above numbers.
A stock options calculator helps evaluate and estimate stock options.
WHAT ARE THE RESULTS SHOWN BY THE STOCK OPTIONS CALCULATOR?
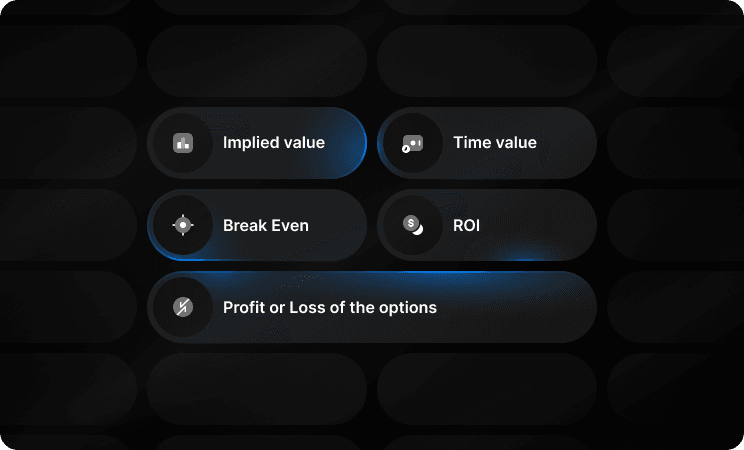
The stock options calculator shows you various results related to your stock options, such as:
- The implied value of the options is the stock price versus the strike price.
- The time value of the options, i.e., the amount by which an option price exceeds the intrinsic value.
- "Break Even," where options are exercisable at a particular stock price, and at that price, you neither gain nor lose money on your options.
- Which is the profit or loss of the options, the difference between (the options and current shares × the number of options).
- The ROI in options represents a percentage of the profit/loss compared to the option price.
For example, based on your input data for ABC options, you see these results:
- The worth of your options is in their intrinsic value (i.e., $5 per option or $60-$50 = $10).
- The cost of your options is $8.23 a piece (after you subtract the $10).
- "Break Even," where options are exercisable at a particular stock price, and at that price, you neither gain nor lose money on your options.
- Which is the profit or loss of the options, the difference between (the options and current shares × the number of options).
- The ROI in options represents a percentage of the profit/loss compared to the option price.
"Break Even," where options are exercisable at a particular stock price, and at that price, you neither gain nor lose money on your options.
Which is the profit or loss of the options, the difference between (the options and current shares × the number of options).
The ROI in options represents a percentage of the profit/loss compared to the option price.

How to I interpret these results?
Such analysis can reveal your stock options' inherent value and behavior in different market conditions. For example:
- If you have options with a positive intrinsic value, they're out-of-the-money — meaning you can exercise them for a gain.
- If your options' time value is positive, they could grow over time and be worth more than their intrinsic value.
- If your breakeven point is below (in the case you write a call) or above (in the case you sell a put) current stock strike, you make any money on exercising your options at any time until the expiration.
- If they return a positive value, you profit from that option. If it is negative, you are losing money on your options.
- A return of 2%, however, denotes that you are getting a decent return on your choices compared to what you spend. When it is low, you receive a low return on your options (compared to what you paid for them).
You can use a stock options calculator to try different scenarios and strategies and better understand how much money to trade options is required. For example:
- You can observe the impact of modifying some input variables.
- Using this tool, you can compare different types of options contracts (call vs. put.)
- You can experiment with various exercise & sell strategies (e.g., early, at-the-money, exercise at expiration), etc.
- However, there is a way to hedge your options with other options or even, in fact, stocks or bonds.
- The ROI in options represents a percentage of the profit/loss compared to the option price.

A stock options calculator is an amazing tool that can help you assess a stock option's value. It results in reducing your risk and maximizing your profit.
However, it is not a substitute for professional financial advice and due diligence.
Other Tools From The Analytics Element
- Live Binary Options Chart
- Technical Summary Box
- Economic Calendar
- Earnings Calendar
- Trader’s Profitability Calculator
- Currencies Heat Map
- Cross Currency Exchange Rates