Free Online Binary Options Charts
Binary trading live is a question of timing above everything else. For most people that means learning to read the charts and understanding what they actually mean.
Updated October 23, 2026
But it’s not just about reading the charts correctly; you must act on that information quickly and decisively. That’s where a good charting service comes in handy, helping you make those split-second decisions with confidence.
One person who had success with reading charts is Michael Freeman. He is a well-known binary options trader who gained his success through reading and interpreting charts. He has developed his system and shared his methods with others through his trading courses and blog.
We’re going to take a look at some things you can learn from success stories in your journey to becoming a successful binary options trader. But first, a primer.
What the live tools on this page show
Three tools sit above this text, and each answers a different question.
The Online Trading chart is the live price chart itself. Switch the time frame between 1-minute, 5-minute, 15-minute, 30-minute, 1-hour, 4-hour and daily, and the chart type between line, bar and candlestick.
The Technical Summary Box condenses several indicators on the current asset into one reading, a quick way to sanity-check your own view.
The Live Currencies Heat Map shows relative strength across currencies, so you can pick which pair deserves a closer look.
All three update on their own, so you see the market as it stands rather than a snapshot from an hour ago.
Why should you use a binary options chart?
Interactive Binary Options charts are necessary for technical analysis, which is vital for Binary Options trading. Charts make it far easier to identify potential trading opportunities. They can also help you spot trends and entry positions to better understand how the market is moving.
There are different types of binary options charts available. Some are more complex than others, but all of them can be used to help you make better trading decisions. IQ Cent’s platform doesn’t provide multiple choices for binary options trading. As a beginner, having an in-depth market chart is super important.
What different analytics chart types exist?
There are several types of charts which can show you different data.
Line chart: the chart type, often used to show closing prices.
Bar chart: A bit more complex than a line chart, but it gives you more information, including both the opening and closing prices and the highs and lows.
Candlestick chart: Candlestick charts are the most popular chart type and are often used by technical analysts. They show the same information as a bar chart, but can give you more information about market sentiment.
Eng (5).jpg
How to read binary options charts?
Now that you know what a Binary Options chart is and its different forms, it’s time to learn how to read them. The first thing you need to do is identify the direction of the trend. You can use several technical tools to identify the movement of an asset. Once you identify a trend, you can determine whether to place a Call or Put Option in your trading strategy.
Next, you need to identify the “support” and “resistance” levels - these are the points where the market is likely to change direction. The support level is the point at which the market is likely to find buyers, and the resistance level is the point at which the market is likely to find sellers. If you identify the support or resistance level, you can predict the asset’s price movement.
You can also use Binary Options charts to spot reversals. Again, these are situations where the market is about to shift. To spot a reversal, you need to look for a candlestick pattern on the chart. Candlestick patterns are formations that consist of one or more candlesticks.
One of the most popular candlestick patterns is the engulfing pattern. This is a two-candlestick pattern where the second candlestick completely engulfs the first candlestick. An engulfing pattern is a strong indication that the market is about to change direction. You can read more about how to use candlestick charts to improve your technical analysis here.
Online trading charts
How do I use a live schedule chart for trading options?
A live schedule chart updates automatically to indicate the current market conditions. When you’re looking at a live chart, there are several things that you need to take into account.
The first thing you need to look at is the time frame of the chart. The time frame will determine the amount of data that is shown on the chart. The most popular time frames are 1-minute, 5-minute, 15-minute, 30-minute, 1-hour, 4-hour, and daily time frames.
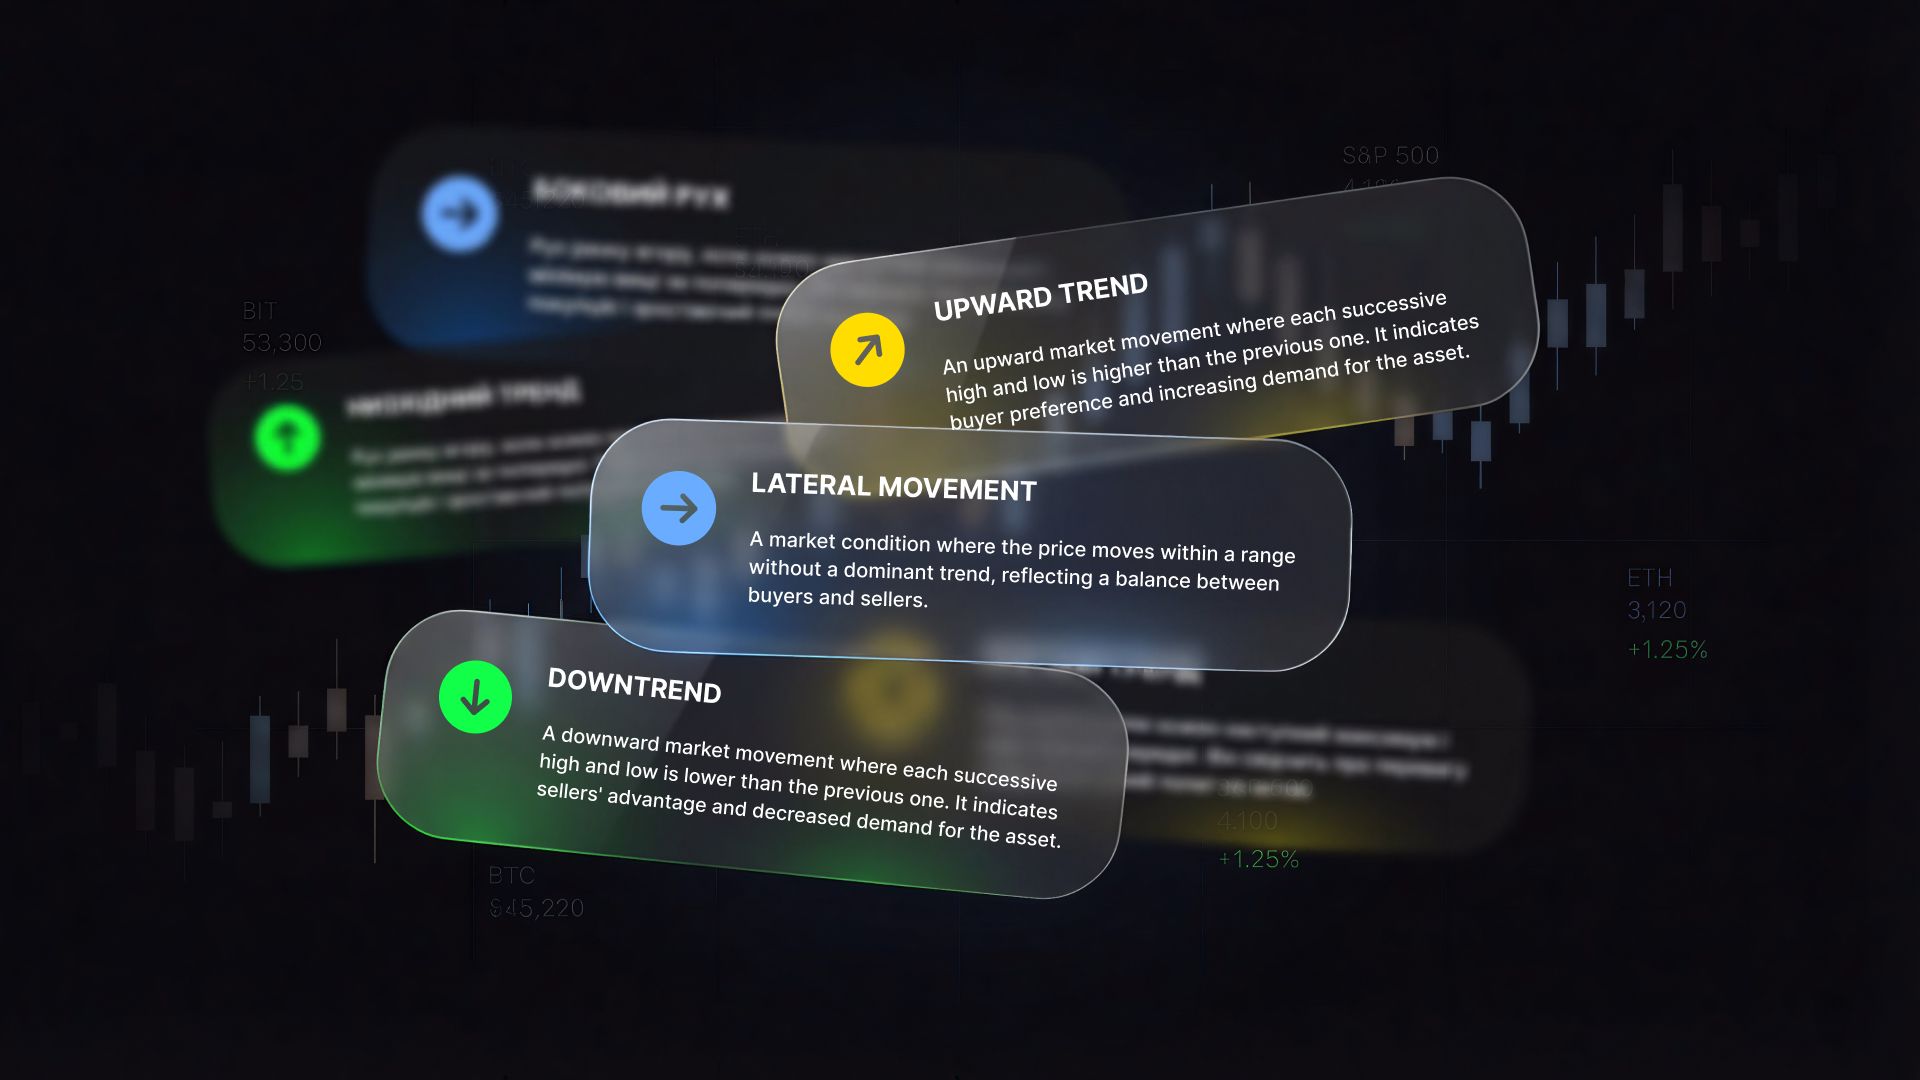
Price action is the next thing you need to consider. Price action can be described as the movement of the price either up or down on the trading chart. It’s categorized into three main types:
Up-trend - The price is moving up.
Downtrend - The price is moving down.
Sideways - The price is not moving up or down (consolidation).
The last thing you need to take into account is the market conditions. Market conditions are the overall conditions of the market. These market conditions include:
Bullish - The market is moving up.
Bearish - The market is moving down.
Neutral - The market is not moving up or down (consolidation).
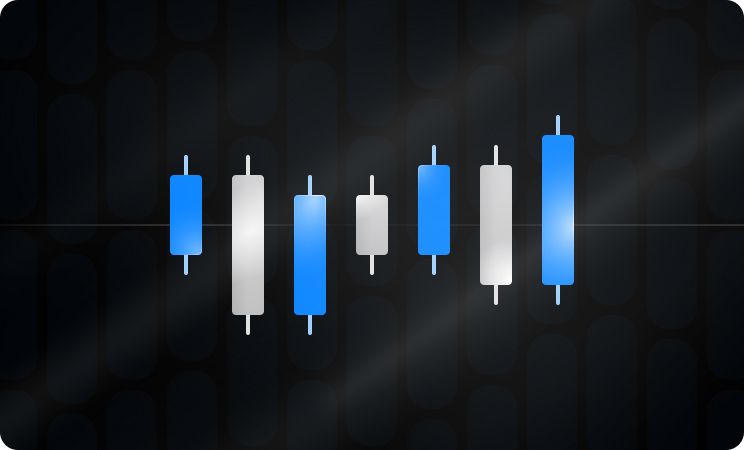
image (5).jpg
Technical Indicators
In addition, you can combine these indicators with technical indicators. The MACD (Moving Average Convergence/Divergence) is one of the most popular indicators you can use. The MACD is a momentum indicator that can help you to spot trend reversals.
To use the MACD, you need to look for two things: the MACD line and the signal line. The MACD line is the faster line, and the signal line is the slower line. When the MACD line makes a cross above the signal line, that is a bullish signal.
On the other hand, a bearish signal is produced when it makes a cross below the signal line. You can use these signals to trade binary options. If you see a bullish MACD crossover, it’s a good idea to buy a call option, and if you see a bearish MACD crossover, you know you should buy a put option.
You can also use Wilder’s DMI (ADX) indicator to trade Binary Options. The ADX is a trend indicator that can help you to spot trends. If the ADX is above 25, it means that there is a strong trend; if it’s below 25, it means that the trend is weak. You can use the ADX to trade binary options by buying call options when the ADX is above 25 and put options when the ADX is below 25.
A worked example: reading the chart before a trade
Put those pieces together on one setup. EUR/USD on the 5-minute chart, ADX reading 31, comfortably above the 25 threshold, so what you are watching is a trend rather than noise. The MACD line crosses above the signal line, and the candle that just closed is a bullish engulfing pattern. Three independent signals point the same way.
Then comes the arithmetic. A contract with a five minute expiry and an 85% payout returns $18.50 on a $10 stake and costs the full $10 when it misses, so break even sits at roughly 54 correct calls in every 100, or 1 divided by 1.85. Three aligned signals guarantee nothing on a single trade. What they do is give you a realistic shot at clearing that line, which a lone MACD crossover rarely does.
Data Reliability
There are several free online Binary Options charts to use, but it’s important to choose one that you can trust. One of the best ways to find a reliable live scheduling chart is to use the one that comes with your broker’s trading platform. However, some brokers have limited data and only show the most popular traded assets.
If you want more data and analysis tools, you can use several free online live charts that give you access to a wider range of technical analysis tools. The most popular free online charting platforms are MetaTrader 4 and TradingView. These platforms have a variety of useful features that can help you hone your binary options trading strategy.
Conclusion
Using the tools and methods outlined above will help you thrive in the binary options trading market. Remember, the most important thing is to choose a charting platform that you can trust.
Once you have found a reliable charting platform, you can use the indicators and charting tools highlighted in this article to trade binary options effectively.
One caveat before you act on any of this. A chart is only as good as the feed behind it, so check that your platform quotes the same price and offers the expiry you are aiming at. If you are still deciding where to trade, compare payouts and expiry times in our broker list, and use the broker hub to see what regulation applies where you live.
FAQ
What is binary trading live?
It means trading binary options against a chart that updates in real time rather than a static image. The live feed shows current price action, so you can time an entry on a signal as it forms instead of reacting to a move that already finished several minutes ago.
How does binary trading live work in 2026?
You pick an asset and a time frame, read the live chart for trend, support and resistance, then confirm the direction with an indicator such as MACD or ADX. If the signals agree, you place a call or put option with a fixed expiry on your broker platform.
How is the result calculated?
A binary contract pays a fixed percentage of your stake if the direction is correct and costs the whole stake if it is not. At an 85% payout a $10 trade returns $18.50 on a win and zero on a loss, which puts break even at about 54 correct calls out of 100.
What values do I need to enter?
For the charts on this page, an asset and a time frame between 1 minute and one day. For the trade itself, your stake, the direction and the expiry. Everything else, from indicator readings to the technical summary, is generated from the live feed.
Can I use it for crypto and forex?
Yes. The same reading applies to any asset with a live feed, and the currencies heat map is built for forex pairs specifically. Crypto moves faster and gaps more often, so short expiries carry more risk of a signal invalidating before the contract settles.
