Updated:September 23, 2026

13 min
13 min

Do you know how to make a profit when nobody knows whether to buy or sell? In this article, I will teach you the Broadening Wedge pattern so that you increase your profitability to the highest possible level. Analyze it on the chart, place the position, and make a profit.

Author

Welcome to one of the essential classic patterns. When the city of Gotham was in trouble, only one light was enough to calm the city and come to the aid of people; that was Batman.
The light appears and helps traders when the market is confused and does not know which direction to go.
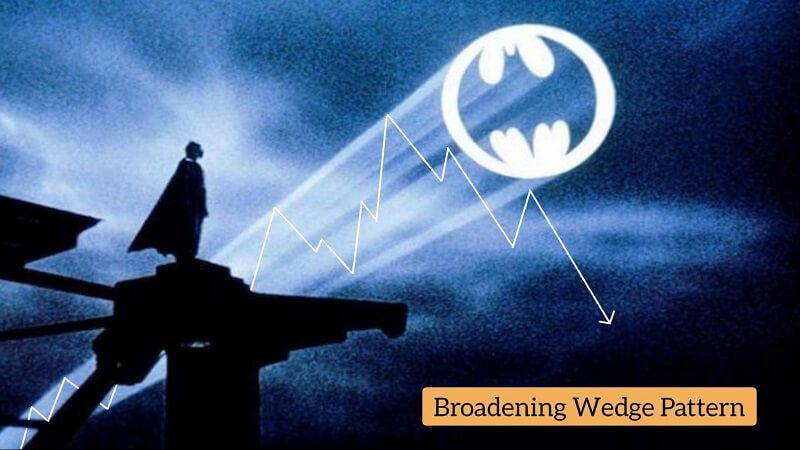
You must be with Batman and the good forces in the battle between good and evil to take your profit from the market. When the market is confused, this pattern can help.
A Broadening Wedge usually forms at the end of uptrends and downtrends. It is rare in the market, but you can easily recognize it when you see it. Just learn what I tell you and introduce them to your trader friends. I love using this pattern because when other traders are confused, I can make remarkable profits, which is a strong point in my analysis.
And you can join me in remarkable profits. This pattern is responsible for about 20% of my overall cryptocurrency market earnings. You, too, can succeed financially if you give it your all. I can’t promise you will beat the Joker, but I’m sure you can be rich as Batman.
The Ascending Broadening Wedge is a reversal pattern that forms at the end of upward trends. A broadening wedge is one of the most reliable classic reversal patterns.
By this pattern, you can earn good profits from the market.
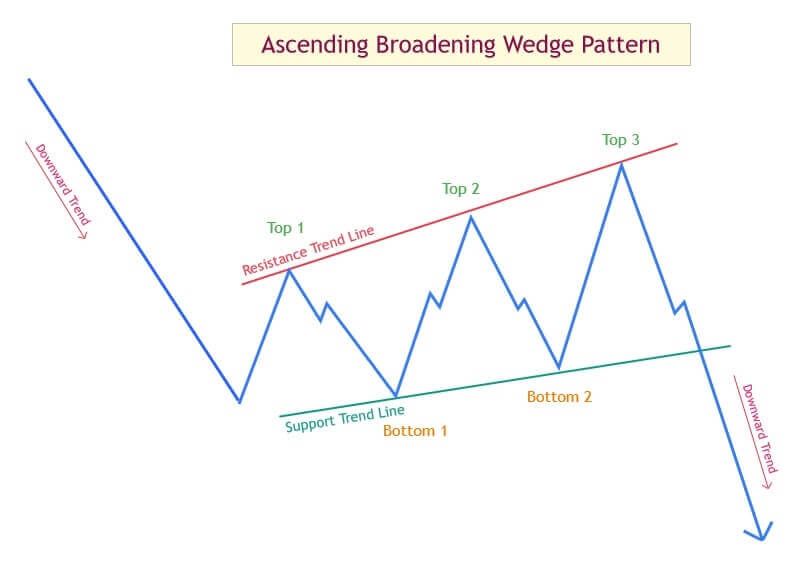
The Ascending Broadening Wedge is a reversal pattern that forms at the end of upward trends. The price is contained between two trendlines. Both of these trend lines have a positive slope, but the slope of the resistance trend line is higher.
In this process, the price makes higher tops and higher bottoms. But the slope of the resistance trend line is higher, so the tops rise faster. This situation does not apply to bottoms, which experience slightly higher prices on a gentle slope.
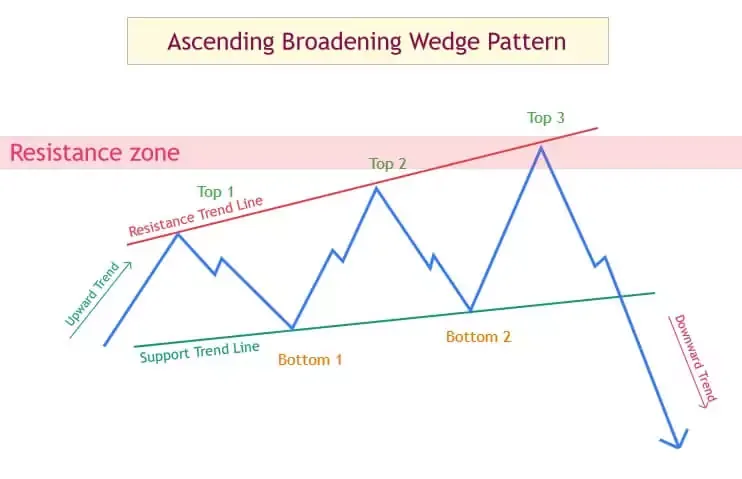
To complete this pattern, we need at least five pivots. In simple words, we need three tops and two bottoms to form an Ascending Broadening Wedge pattern.
The pattern is complete when the price reaches the support trend line after the third top. The number of tops and bottoms can be more than this, but 5 pivots are the minimum necessary to complete the pattern.
An Ascending Broadening Wedge is more attractive for two-sided markets because we can open a short position on it, but in one-sided markets such as stocks, it can signal a trend reversal.
Recently, it has become clear to traders that big organizations or market makers hunt our stop losses. They buy where we sell, and they sell where we buy. After all, they need a customer for their stock or currency.
In this area, the price gets confused, and traders start buying. One of the reasons for novice traders to buy at this zone is the formation of higher tops and higher bottoms. They fall into a trap set by the market makers.
The big boys make an uptrend with high momentum so that you place a long position on the chart. Then they sell you everything they have, and the price falls. They profit, and you lose. But I don’t want you to lose; I want to help you in this situation.
During the formation of the pattern, market volume increases by forming each wave in a battle between buyers and sellers. Which one wins? Market makers have reached their goal because they sell all they have to the buyers at the highest price, and after that, the market goes down.
So, the sellers won, but the trend was bullish; how is that possible? We have made a tunnel under the big banks and are aware of their intentions.
In this situation, you will not lose; in fact, you can make a considerable profit with the market makers. It’s about tens of thousands of dollars annually.
Trading on the Ascending Broadening Wedge pattern
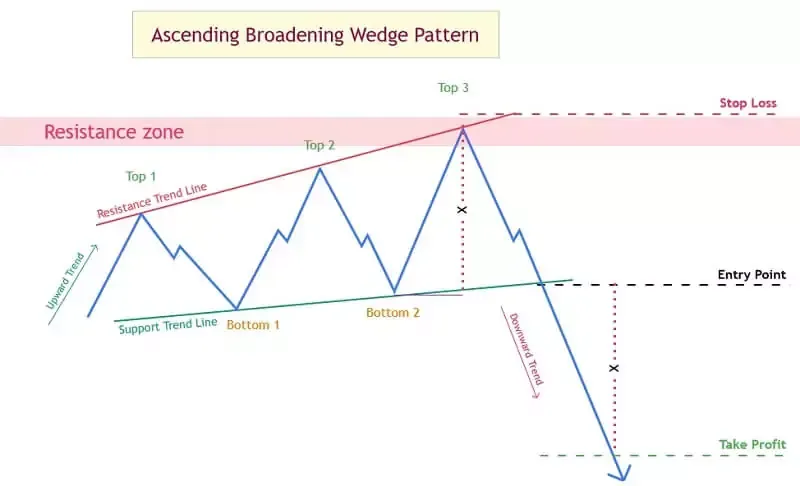
After forming the third top, the pattern completes and is ready to take profit. When the price breaks the support trend line, it gives a signal to enter the market.
You can confirm the validity of the breakout by using the candlestick patterns. After the break of the support trend line, you should wait until the breakout candle closes below the support trend line; at that point, you can enter a short position.
In this pattern, the stop loss is above the last top. But you can modify it with your strategy. For example, I place the stop loss above the breakout candle to get a higher risk-to-reward ratio. The take profit equals the distance between the highest bottom and the highest top.
If there were artificial intelligence here, it would say that I have checked thousands of methods, and this one is the best method. Look at my short position on the AUDUSD chat on the 5-minute time frame.
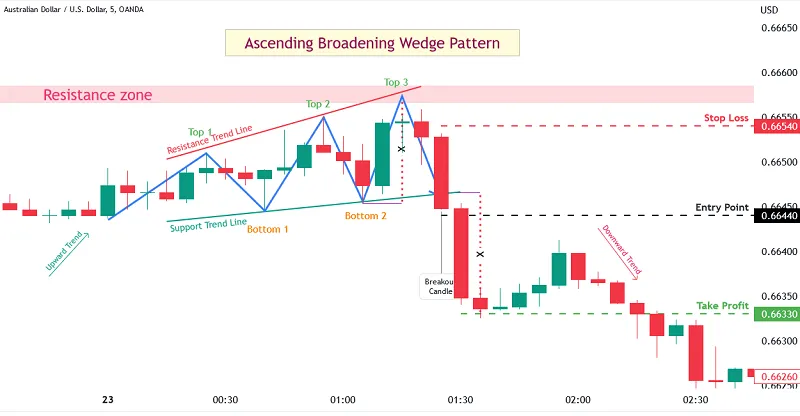
When the price broke the support line, I waited for the breakout candle to close below the trend line. Then I entered a short position at 0.66440 USD and placed the stop loss above the breakout candle at 0.66540 USD.
Of course, this action increases the risk of my position, but I have tried it a lot, and based on my capital management system, I have determined it to be the best method.
My take profit in this position was equal to the distance between the highest top and highest bottom, and I placed it at 0.66330 USD. In this position, I was able to make almost $4,000 within 1 hour.
The positions I get on the broadening wedge patterns are extremely valuable to me. Because in these situations, traders usually lose money, but I profit from the market with my strategy.
Failed Ascending Broadening Wedge pattern
Ascending broadening wedge patterns fail in some cases. This pattern must have at least five pivots (three tops and two bottoms) to be considered an ascending broadening wedge.
When the price tries to form the third bottom and reaches the resistance trend line, the pattern may fail. For a failed pattern, we need at least six pivots.
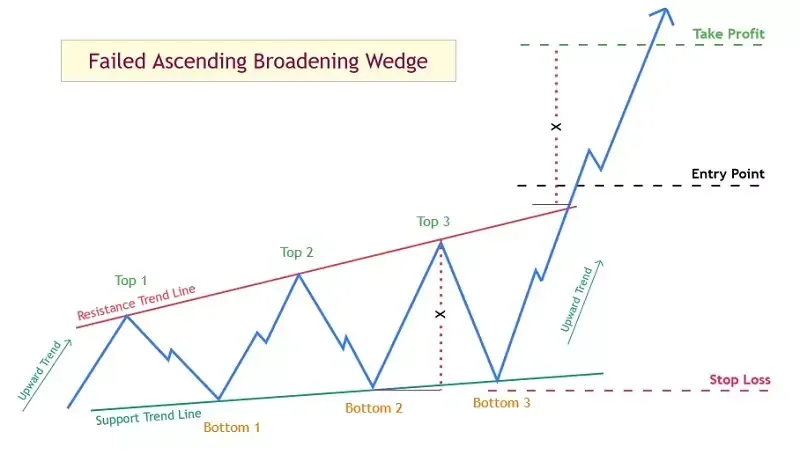
Of course, this does not mean that the price always fails after the 6th pivot. Sometimes the price forms more tops and bottoms than this number, which can still be valid.
Only after the break of the resistance line do we say that the pattern has failed and we can make money from it. Like a phoenix, this pattern revives after death and gives you the benefits.
All you need to do is enter a long position after breaking the resistance trend line and place the stop loss below the last bottom. Take profit is the same as before, the distance between the highest top and the highest bottom.
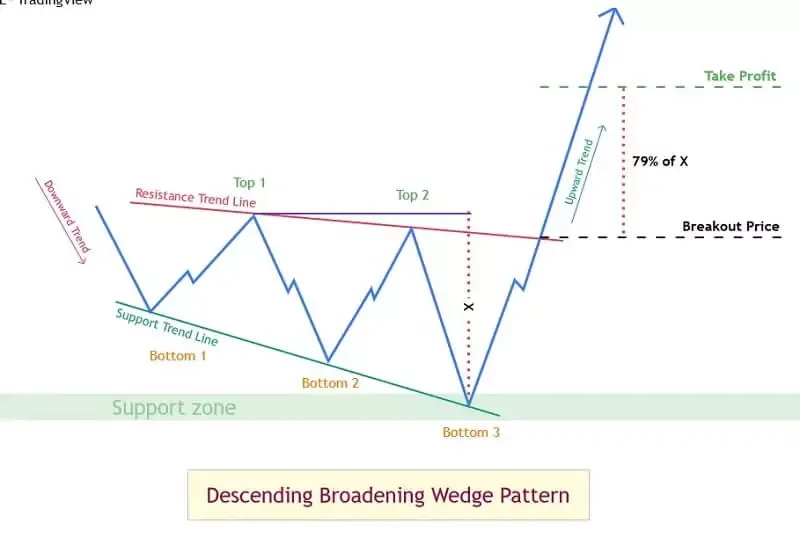
Descending broadening wedge is a reversal pattern that forms at the end of the downward trend, and the price enters an upward trend after that. This pattern is as valid and robust as ascending broadening wedge.
In bilateral markets, you can open a short position on this pattern
As I said in the previous pattern, Big Boys or banks that have a lot of capital need liquidity for their long-term goals, and they get this liquidity from small traders. This pattern forms when market makers create lower tops and bottoms, encouraging sellers to sell.
Their goal is to buy as much as possible; then the market becomes all buyers and the price rises. Sellers lose, and buyers make a good profit. During the formation of the pattern, the market volume increases with the formation of each wave.
The market is emotional and confused, and bears (sellers) enter the market with all their hearts and souls. Big investors enter here and buy whatever the bears are selling, setting themselves up for an uptrend with high momentum to make a good profit.
Now, you should also think like the buyers and market makers. But what makes you change your opinion about the market and buy in a downward trend? The answer to this question is the Descending Broadening Wedge pattern.
The price fluctuates between the support trend line and the resistance trend line. Both have a negative slope, but the slope of the support trend line is higher. To complete this pattern, we need at least five significant pivots; the price must create at least three bottoms and two tops to complete the pattern.
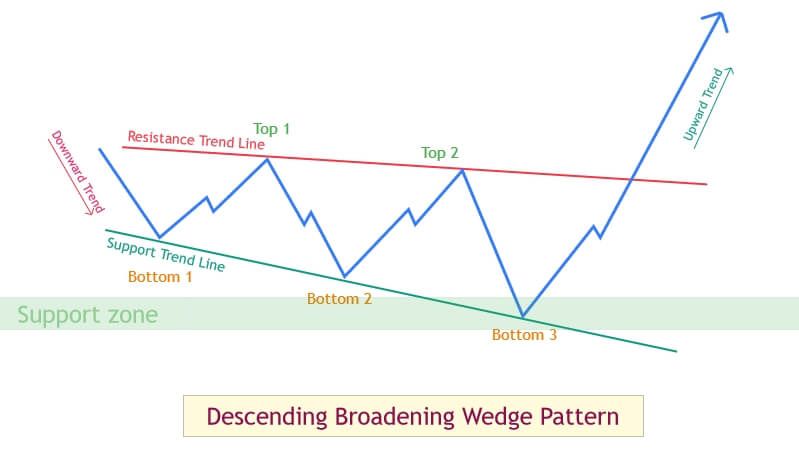
Of course, the price can make more bottoms and tops, but we need five pivots as a minimum. Be aware that the number of pivots or tops and bottoms should not be too high because this will decrease the validity of the pattern.
When the third bottom forms and the price reaches the resistance line, the pattern completes, and we can wait for the entry confirmation. Descending Broadening wedge patterns have many fans in both one-sided and two-sided markets because we can open a long position in both.
Trade on the Descending Broadening Wedge pattern
After breaking the resistance trend line, the price signals to open a long position. But how? First, you should check the validity of the breakout. You can use candlestick patterns for this. A breakout candle like a Marubozu candle is excellent.
After closing the breakout candle above the resistance trend line, place a long position above the breakout candle and place the stop loss below the last bottom. You can set the stop loss below the breakout candle for a higher R: R. The take profit in this pattern equals the distance between the lowest bottom and the lowest top.
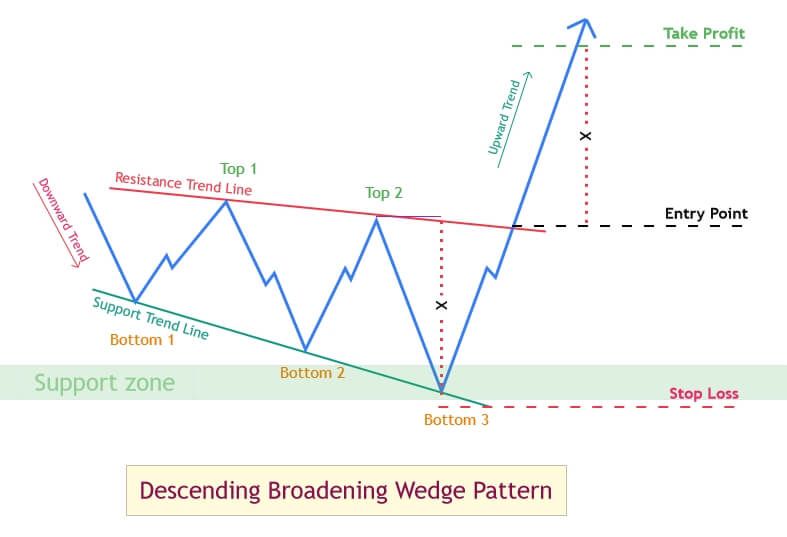
Look at my trade on the EURUSD chart on the 1-minute time frame.
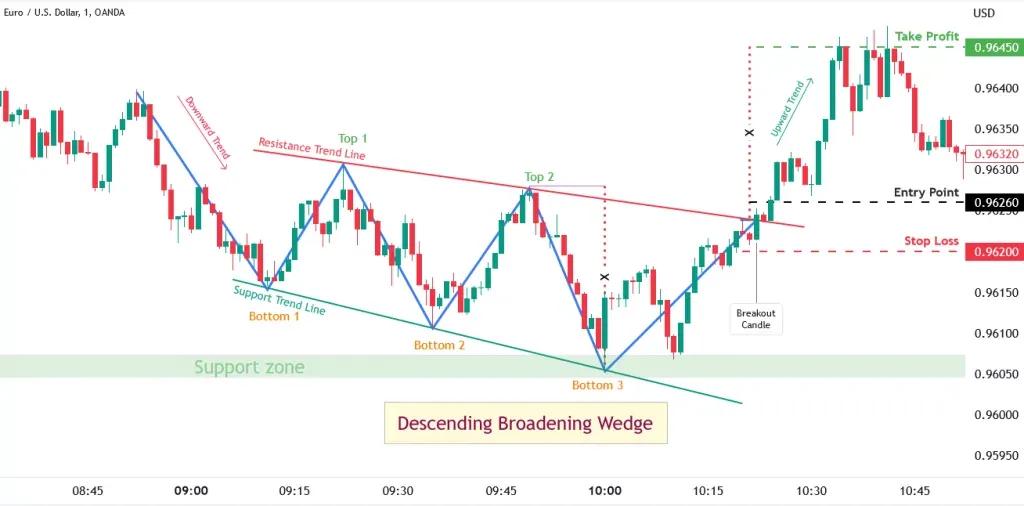
On a sunny day, I identified this pattern on the chart and waited to confirm the breakout by closing the breakout candle above the resistance line. Then, I entered the position at 0.96260 USD.
I placed the stop loss below the breakout candle at 0.96200 USD. And my take profit was equal to the distance between the lowest top and the lowest bottom, and I placed it at 0.96450 USD.
In this position, I made a profit of almost $7,000 and bought Tesla stock (TSLA) with that. It was an excellent trade and a work of art.
Failed Descending Broadening Wedge pattern
This pattern may fail, but there is no need to worry because we have planned for that, too. After the formation of the fifth pivot, the pattern completes. The pattern fails if the price breaks the support trend line and goes down.
After the true breakout, you can enter a short position. Enter the short position below the breakout candle and place the stop loss above the last top. The take profit equals the distance between the lowest top and the lowest bottom.
This can be a great position when the price is excited, even when the reversal pattern has failed. Escape from loss and make a profit in a wholly engineered way. It’s essential to always keep in mind that when a reversal pattern fails, it transforms into a powerful continuation pattern.
Bulkowski, one of the great researchers of classic patterns and technical analysis, has reached exciting results regarding the broadening wedge pattern and presented them in 2005.
These statistics help you to increase your win rate in the financial markets. I have collected the most important statistics about Broadening Wedge in this article

Let’s read some of his research together:
Bulkowski also did a lot of research on price targets in this pattern.
For the ascending triangle wedge, he chose the target of 58% of the distance between the highest top and lowest bottom in the pattern.
The target of the descending broadening wedge is 79% of the distance between the highest top and the lowest bottom in the pattern.
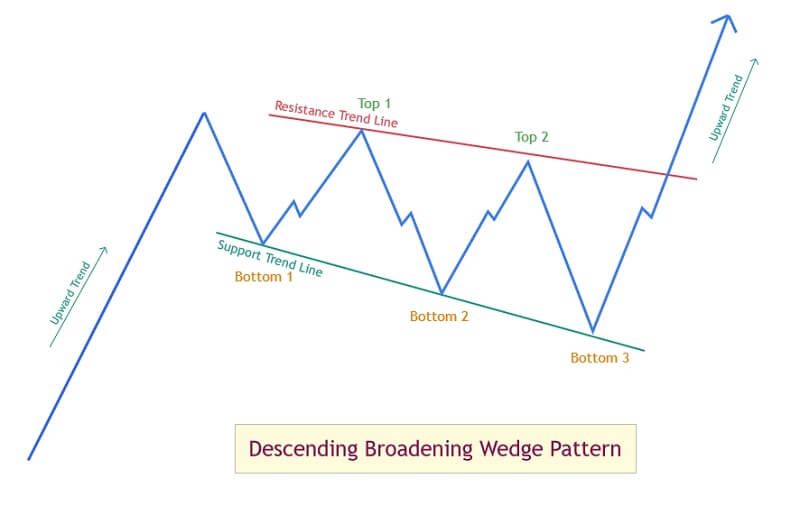
A broadening wedge pattern can appear as a correction in the middle of trends. In these cases, the entire correction movement is a broadening wedge pattern. You can see it as a continuation pattern.
In this case the broadening wedge ends the correction movement, and the price continues its trend after forming this pattern.For example, in an upward trend, the correction movement or the pullback could be a descending broadening wedge pattern, and the price continues its upward trend after that, which you can see in the picture below.
In a downward trend, the correction movement can be in the form of an ascending broadening wedge, and the price will continue the downward trend after forming that.
Broadening Wedge patterns also have a unique role in Elliott’s theory. The Elliott theory is one of the most exciting topics in technical analysis.
By learning this topic, you will perform advanced analyzes in the future.
We can see an ascending broadening wedge in wave 1, called an expanding leading diagonal. There aren’t many expanding leading diagonals in the chart; instead, we typically see expanding ending diagonals.
This pattern can also be in wave 5, which we call expanding ending diagonal. Each has 5 sub-waves: 1, 2, 3, 4, 5. Descending Broadening Wedge patterns also exist in Elliott waves.
They can form at wave A as expanding leading diagonal patterns and at wave C as expanding ending diagonal patterns. Each has 5 sub-waves: 1, 2, 3, 4, 5.
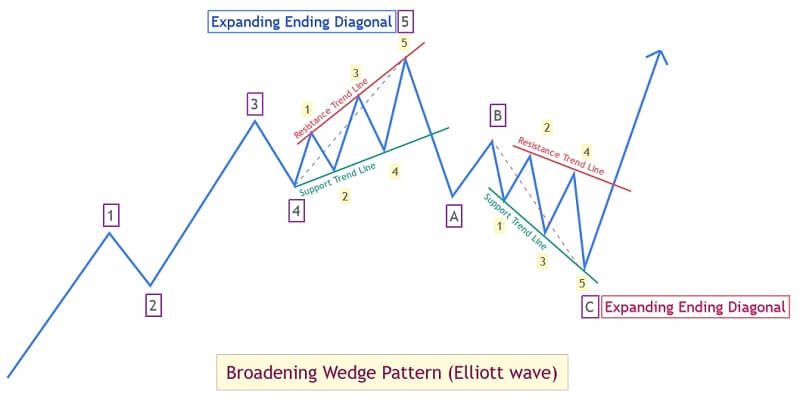
The Elliott wave topic is much broader; I will discuss it in detail in the following articles.
In this article, you learned the critical point that you should never enter a position with emotions and excitement. You should enter the market with reason and logic by good patterns.
Try to learn new subjects every day to add to your knowledge and analyze the market better. The market is full of traps and tricks. It is enough to enter a position without sufficient information, they catch you in their trap, and all your money will go into their pockets. But there is no need to worry.
I am here with you, and I will show you their card. There are many points I taught you, so try to read my previous articles and wait for the following ones. You will get the result by practicing and repeating the tips I taught you.
You have to be patient to become one of the professionals in the market. Don’t forget that capital management is crucial, and you should value the money you have. Because an essential thing in the market is that you must have money to make a profit, So don’t lose your money.
Thank you for being with me in this article. I hope you have a good day. The Elliott wave topic is much broader; I will discuss it in detail in the following articles.
Find Your Perfect Broker: Explore Our List Now!
Choose the best with our expert-selected options

Find Your Perfect Broker: Explore Our List Now!
Choose the best with our expert-selected options
Discover top binary options brokers tailored to your region. Browse our curated lists by country:
1956