Understanding the Currency Heat Map Tool
Stats suggest that over 70% of people trade with technical tools. Among these tools, the currency heat map is a must-have.
What is a Forex/Currency heat map?
If you’re not familiar with the currency heat map, let’s first discuss what it is, since it differs from most other technical tools. In the forex marketplace, we usually view exchanges strictly in pairs. The HM (heat map) allows you to visualize the performance of a single currency. It’s an essential tool for technical traders.
“Over 70% of CFD Traders Use Technical Analysis or Charts to Make Trading Decisions”
by PRNewswire
Think of a heat map as a drawing – an illustration of the forex duos. It depicts the strength of exchange when you compare them to others. You know how pairs relate to each other, right?
A correlation between two currencies works like a bridge. The heat map can help you identify how much a single currency has changed against others, making connections between two distinct exchange pairs.
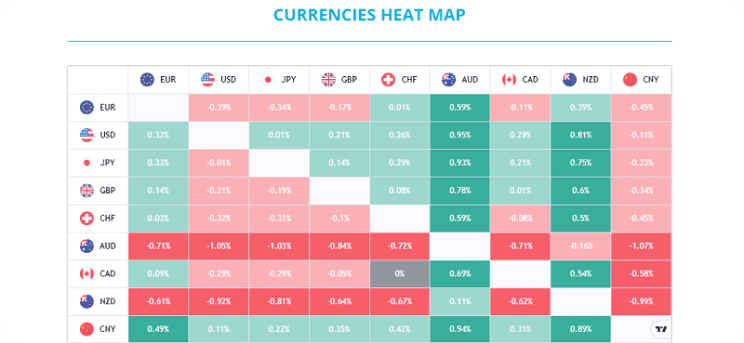
Data from 28 pairs form colorful results in an exchange heat map, producing an illustrative perspective of the entire forex market. By focusing on only one duo and one timeframe, many traders miss the big picture of the marketplace. A heat map is a go-to means for filtering transaction noise.
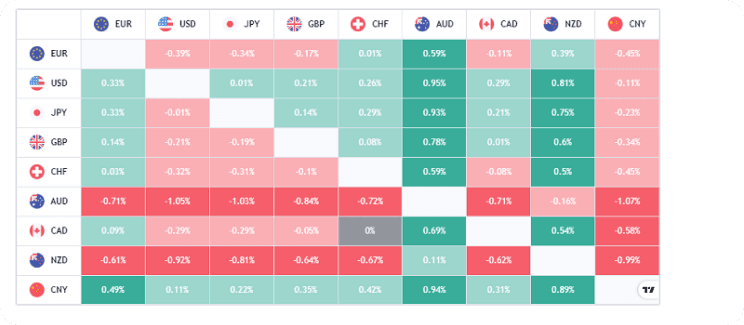
As you can see, the dark green represents that the forex pair is above the previous level. The lighter shade of green is when the FX is above the previous bar’s close, but below the high. If it’s gray, it means the pair is flat. The pink color means that the FX is below the previous bar’s close, but above below.
And finally, when it’s red, it means the FX is below the previous bar’s low. So, the chart conveys to you graphically what’s happening in the price action. It is possible to use heat maps with forex, binary options, and CFDs.
You can also incorporate the diagram into any trading style. The heat map is easy on the eyes and conveys a large amount of useful information in one neatly-contained graphic.
How to read Forex heat map?
Now that we’ve talked about how a heat map works, let’s explore how we can utilize this tool to inform our trades.
When looking for a forex HM approach, here’s what you need to know:
- It displays the 28 major exchange pairs as a listing.
- In roughly 30 seconds, you can examine the map interactively.
- The HM places a box next to each exchange pairing. The box’s size and shade represent the relative strong point of the two currencies.
- A percentage also reflects the variation in the exchange’s values.
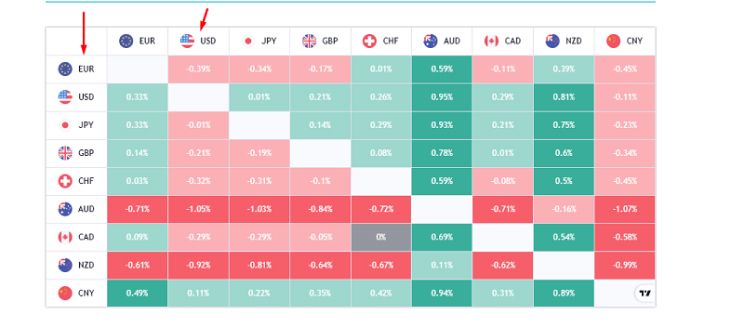
- The base pops up in the left column.
- The quote emerges in the top row.
- We will always deal depending on the base versus the quote.
Remember how the colors of the heat map come into play:
- Green: denotes an increment of the base relative to the quoted rate.
- Red: indicates a devaluation of the base price relative to the quoted price.
- Grey: represents neutrality, with no variation of the base relative to the quote currency.
However, utilizing these analyses won’t predict the continuity of a trend with absolute certainty. I suggest you combine this data with other basic evaluation methods. For example, you can use a currency heat map in tandem with an economic calendar.
A skillful contrast of these data points will boost your trading ability. Many people utilize an exchange heat map in conjunction with a pivot chart.
To do this, we must first choose the appropriate range, then examine the behavior of the exchange pair within it. Making a routine of checking a heat map daily will increase your day trading and better inform you of trends in the market.
What are the benefits of the Forex heat map?
Now, let’s highlight the importance of heat maps for forex trading in particular. Did you know that you get 50% more opportunities using the heat map for forex trades? The forex heat map tool reveals the total capacity of 28 pairs to you. It may also expand your pips in the bag.
The majority of forex traders employ typical indicators, which connect to forex pairs rather than distinct exchanges. The heat map, however, doesn’t revolve around a single FX. Instead, it employs the pairs as indicators, with each pair joined by one exchange. It is a straightforward but innovative solution to market research.
The heat map uses each pair as mini indications on the broader area to create the entire image. This allows you to view the overall market in a glimpse and swiftly identify market momentum. However, beware of overbought and oversold zones of the pairs.
The most recent patterns form the basis for trading activities, but the marketplace may occasionally begin to move in the opposite direction. You know that the news makes the market go wild; the opposing side of the market is because of current news or economic volatility.
If the FX heat map patterns are constant, these pairs are exchangeable in many circumstances. We may also call them additional trades.
As a result, you can utilize the heat map to drive trading inputs into trending pairs. It detects existing market dynamics regardless of whether a pair is moving or not, and it also alerts you when the marketplace or specific pairs have uneven signals. This can convey a warning of when not to join a transaction.
Using this tool can help you avoid fake-outs, price surges, and other issues. The chart also aids in determining the likelihood of entrance to each possible trade. You may also find if the market is sideways or in a high-risk phase. In short, it’s an excellent risk-management tool for all trades, and it can help reveal to traders why pairings move in the manner they do on a daily basis. Heat maps can also keep you in the loop for new trade possibilities.
Though it works well on its own, you’ll get the most out of a currency heat map by using it along with other indicators. You can see the info from the chart and then technically analyze the pair. When you integrate the real-time map indications with other tools, your trading will doubtlessly improve.
Final thoughts
So, that’s about it! Now, you know what the heat map is all about, and can add it to your arsenal of trading analysis tools. The table acts as a complete tool, guiding you where the price action is heading. Once you know how to use it, you’ll be able to more easily stay on top of market trends.