Updated:November 13, 2026

10 min

0
Learning price action trading: levels, candles and a trade plan
Price action trading studies what price does around important levels, rather than waiting for an indicator to issue a buy or sell alert. Traders examine swings, candles, breakouts and failed moves to form a trade idea. The chart does not become magically predictive when indicators are removed. The advantage is that the evidence can be written down and tested: a level held, a breakout failed, or a trend formed a higher low.

Jinia Shawdagor
Author

Updated November 13, 2026
What price action is and why traders use it
Price action is the sequence of market prices over time. Candlesticks summarize open, high, low and close for each interval, while swing highs and lows reveal the structure between them. A trader can use that information to identify areas where buyers or sellers previously became active. The approach is common in forex, futures, stocks and crypto because all traded markets produce prices.
Discretion is its main challenge. Two traders may draw different support zones on the same chart. Without clear rules, a backtest turns into a collection of attractive screenshots. Good price action work relies on defining what qualifies as a level, when a candle is confirmed and which price would prove the setup wrong.
Support and resistance: drawing levels that matter
Support is an area where previous selling met enough demand to slow or reverse a decline. Resistance is an area where previous buying encountered supply. These are usually zones, not laser-thin lines that price must respect to the cent. A market can test the same area several times and still break through on the next attempt. Levels describe history and possible future interest, not guarantees.
A practical way to mark price zones
Start on a higher timeframe, such as daily or four-hour. Mark the most obvious recent turning points, especially areas where price moved away quickly. Reduce the chart clutter; five high-quality zones often help more than fifty thin horizontal lines. Check whether a zone has already been tested many times. Repeated tests can attract attention but may also consume the resting orders that once supported it.
A level becomes more relevant when it aligns with current structure. An old resistance area broken during a strong rally may be retested as support. Watch how price behaves there rather than assuming the role reversal has occurred. The market may slice straight through.
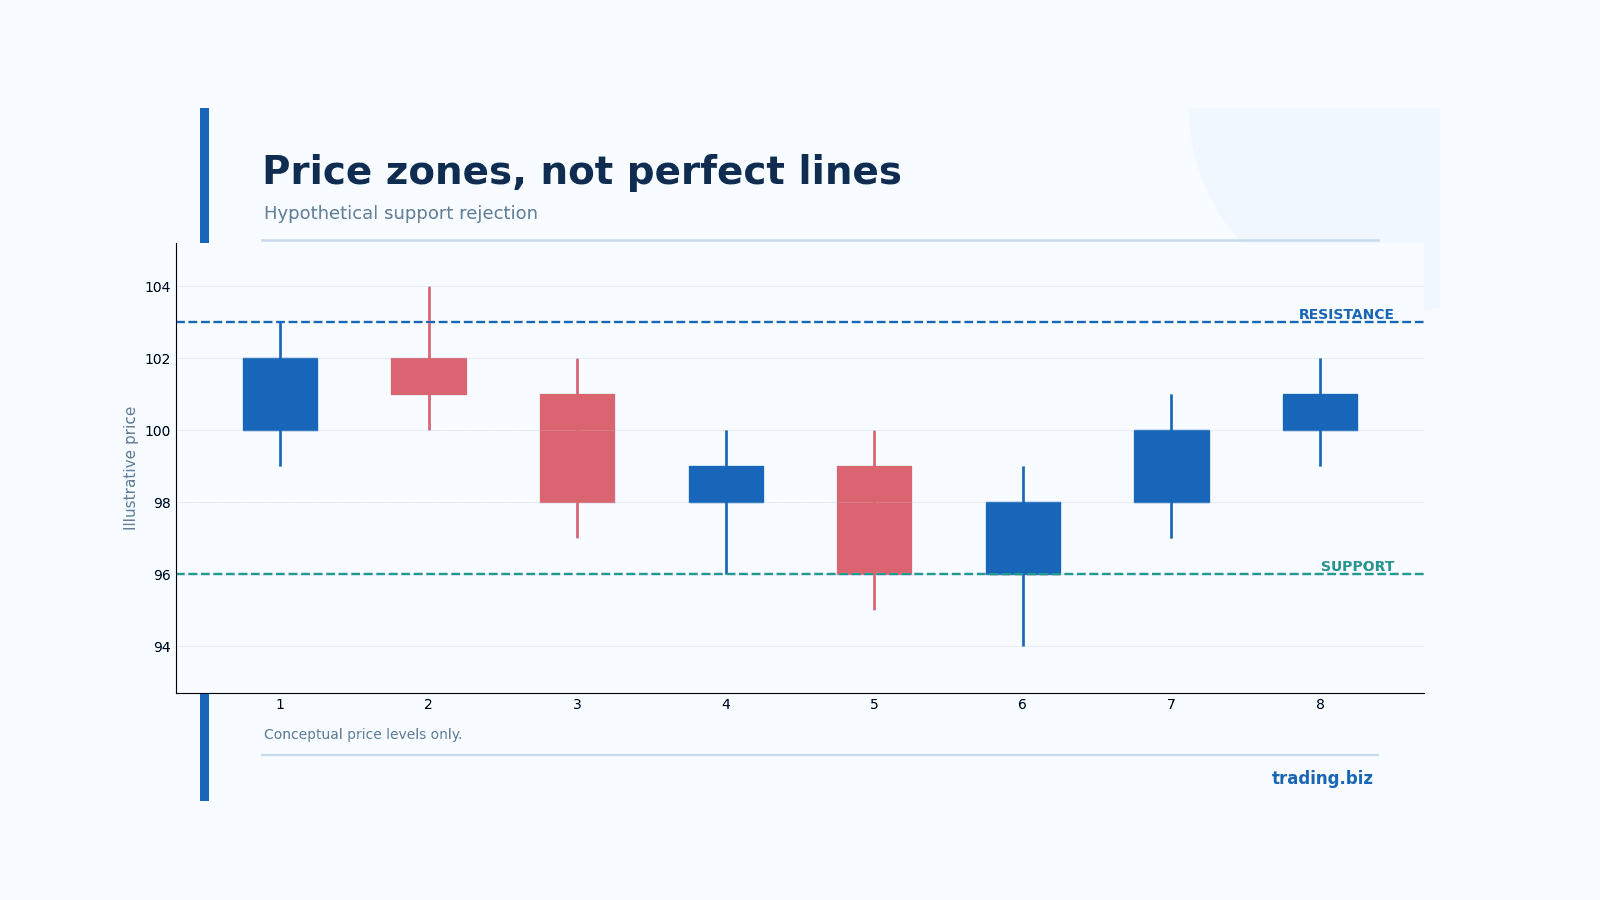
Figure 1. Price action support works as an area rather than an exact line.
Candlestick patterns that carry meaning at a price level
A pin bar has a pronounced wick and a body located toward one end of the candle, suggesting price was rejected from an area during that period. An engulfing candle has a body that covers the previous candle's body under a commonly used definition. Neither pattern matters much in isolation. A long lower wick in the middle of a random range may have little significance; the same shape after a test of weekly support can carry a more coherent story.
Reading a candle without overinterpreting it
Look at where the candle opened and closed, which side controlled the finish, and how it fits with the candles before it. A bearish engulfing candle after a long rally may signal hesitation, but one candle cannot reveal every order behind the move. Traders often enter too early because they see a familiar shape before the period has closed. Waiting for the candle close avoids part of that hindsight problem, though it can worsen entry price.
Volume may add context on exchange-traded products where reliable volume is available. In spot forex, platform volume is often tick volume rather than a consolidated measure of all market activity. Use it with that limitation in mind.
Trend structure: higher highs, lower lows and breaks
A rising trend commonly forms higher swing highs and higher swing lows. A falling trend forms lower highs and lower lows. A market can also spend weeks moving sideways, making both trend labels unreliable. Before trading a breakout, identify whether price is trending, ranging or changing from one state to another.
A break of structure is meaningful only if the swing level was defined consistently. If you keep changing which high matters after the market moves, every chart will appear to predict itself. One useful rule is to mark confirmed swings only after a minimum number of subsequent bars or a defined retracement.
Trendline breakouts need confirmation
Trendlines are convenient visual guides, but their angle depends on the points selected. A trendline break by one wick does not prove a new trend. More practical evidence may include a close beyond a horizontal swing level, followed by a failed attempt to return. That is a testable sequence, unlike the vague instruction to trade every line break.
Three price action trading setups with entry, stop and target
A setup should have three numbers or zones before it becomes an order: where you would enter, where the idea is invalidated and what target offers enough potential reward. The following examples use hypothetical prices so the mechanics can be checked without mistaking them for real recommendations.
Setup 1: support rejection
Imagine an asset has repeatedly found buyers near $95. Price briefly falls to $94.40, then closes back above $95 with a long lower wick. A trader might enter only if the next candle confirms a move higher, set a stop below $94.40 and aim toward the next resistance at $99. If an entry at $95.50 uses a stop at $94.20, risk is $1.30 per share and potential reward to $99 is $3.50, or about 2.69 times initial risk before fees. A weak confirmation or poor fill can change that ratio.
Setup 2: breakout and retest
Mark a resistance zone near $110. After a strong close above it, wait to see whether the next pullback holds the broken level. A long trade may be considered on renewed buying, with a stop below the retest low. The danger is an immediate false breakout. A rule that waits for a candle close can reduce some impulsive entries but cannot eliminate failed retests.
Setup 3: failed breakout
Price breaks above a range, draws in buyers and then closes back inside. Some traders call that a bull trap. A short idea may target the range midpoint or opposite edge, with a stop beyond the failed high. The trade fails if price reclaims the breakout. Never assume that every false-looking move was designed to trap anyone; the chart shows a price sequence, not the motives of individual participants.
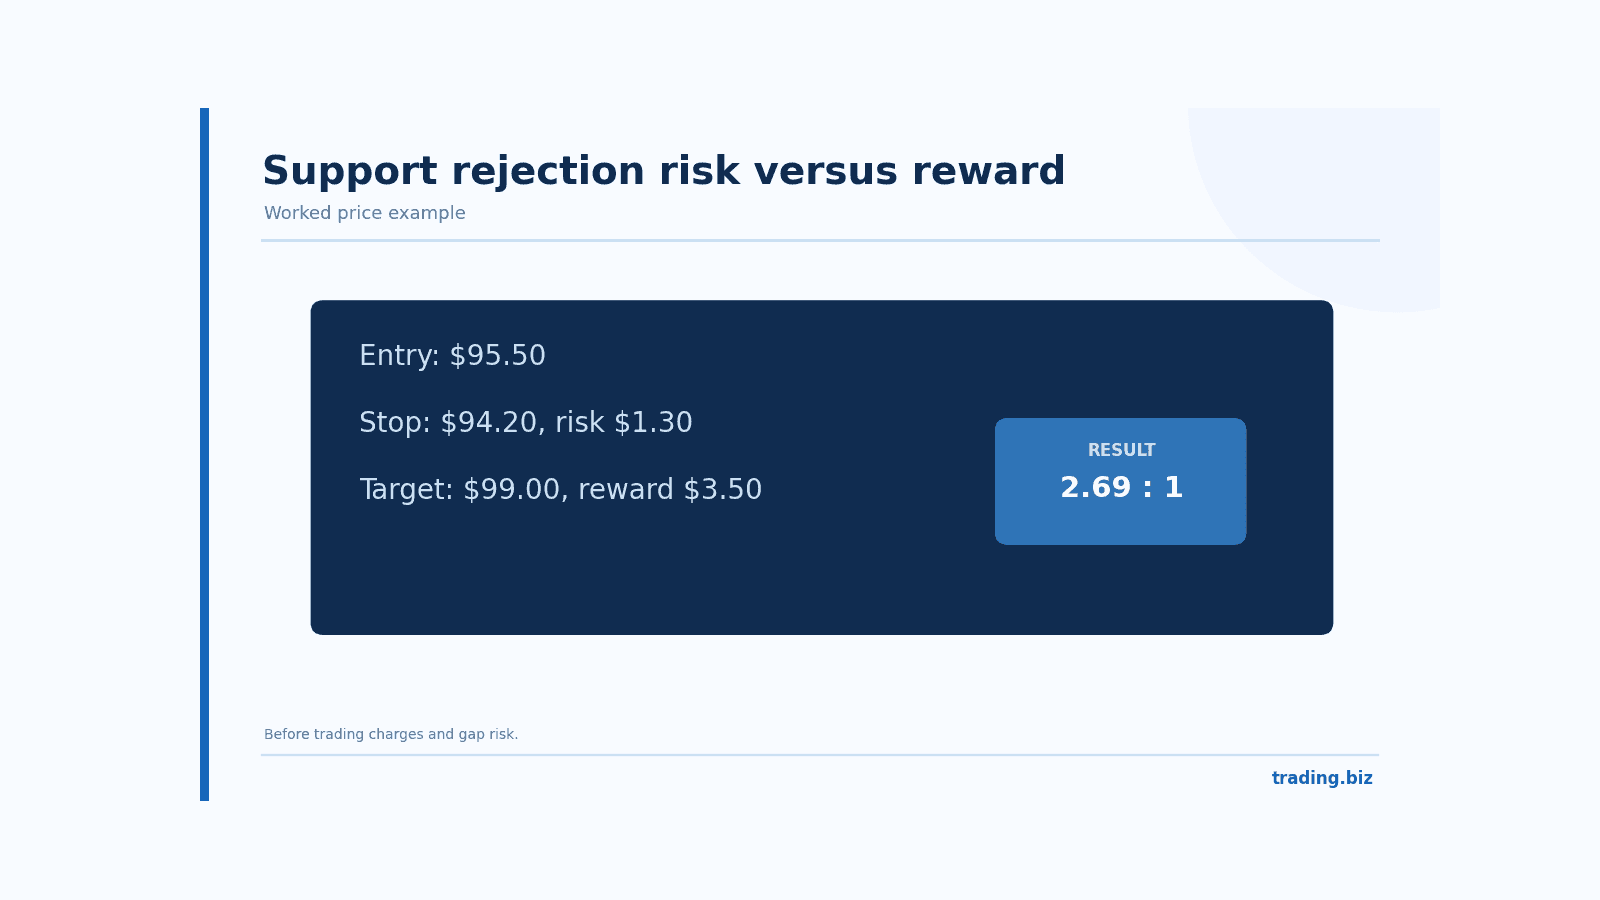
Figure 2. Entry, stop and target values determine initial reward to risk.
Building a price action trade plan and journal
Use consistent language. A plan can state: "Trade daily support retests after a four-hour reversal close, only when the target is at least twice the planned stop distance." It should define allowable instruments, session, maximum account risk and events that cancel a setup. The exact rules may change during research, but not halfway through a losing trade.
The journal should preserve the original chart at entry and the chart at exit. Write down whether the level was genuinely marked beforehand and whether the stop followed the plan. Separate rule-following losses from rule-breaking wins. Without that distinction, a few lucky profits can teach the wrong lesson.
How much chart history do you need?
Enough to see different market conditions. A setup tested during a smooth rally may struggle in a sideways market or during volatility shocks. Review multiple years or several distinct regimes where the data permits, using the same entry definitions. Watch the cost of each trade. A handsome-looking chart pattern is not an edge until the complete trading process survives realistic evaluation.
False breakouts belong in the data too
If a price action strategy enters every daily close above a range, record the closes that reverse the next day. Do not exclude them later as "obvious traps" unless the rule for identifying a trap was documented before the breakout. The same principle applies to pin bars and engulfing patterns. A good-looking historical chart can contain dozens of setups that were ambiguous in real time.
A useful review places valid winners, valid losers and skipped setups side by side. Look for recurring conditions that might explain the results, such as time of day, proximity to a weekly level or a scheduled event. Then test those conditions in a later period. A filter that makes a chart prettier after the fact may never survive live use.
The trade journal should preserve original levels
Save the chart just before entry with every relevant support and resistance zone visible. Later, compare the original zones with the ones you would draw today. This reveals how much your level placement drifts with hindsight. A repeatable method should let another trader mark largely the same areas from the same earlier data.
If a position wins after you ignored the stop or changed the target, mark it as an execution error despite the profit. The journal is a tool for refining decisions, not a collection of proof that every instinct was right.
Price action is sensitive to the time window
A daily candle depends on the broker's session close. Two forex platforms can form slightly different daily bars, changing whether a pin bar or engulfing pattern appears. On stocks, premarket and after-hours data can alter apparent levels. Choose a data feed and session definition before backtesting. A strategy whose signals shift whenever you change the chart source needs extra scrutiny.
The same applies to tick charts and low-liquidity crypto pairs. A candle pattern with a wide spread may reflect sparse trading rather than meaningful rejection. Compare the setup with available volume and market depth where those data are reliable.
Turning a price zone into a backtestable rule
For a support rejection, define how far price may penetrate the zone, whether a candle must close back above it and how long the setup stays valid. Then define the stop placement and the first target. A rule such as "close back inside a zone after a wick extends at least half the average daily range" is measurable, although it may or may not work. A statement such as "buyers clearly defended support" is much harder to test.
Keep the calculation of reward to risk honest. If the planned stop is $2 away and the next serious resistance is only $1 away, the chart offers less than 0.5R before costs. You are free to reject the trade. Passing on a low-quality setup is an integral part of a selective price action method.
FAQ about price action trading
Is price action trading possible without indicators?
Yes. Traders can base a plan on support and resistance, swing structure and candlestick behavior. The trade still needs defined risk and exit rules.
Are pin bars reliable on their own?
No candlestick shape is consistently reliable in isolation. Location, trend context, timeframes and trading costs affect its usefulness.
What is support becoming resistance?
It describes a level that previously attracted buyers but may attract sellers after price breaks below it. The role reversal needs observation, not assumption.
Is price action better than technical indicators?
Neither approach guarantees an edge. Price action can be easier to explain, while indicators can make some observations more objective. A tested process matters more than the label.
What should a price action trading journal include?
Save the chart before entry, the exact setup criteria, entry and stop prices, target, result after costs and any deviation from the original plan.
Official reference: CME education resources
Find Your Perfect Broker: Explore Our List Now!
Choose the best with our expert-selected options
Find Your Perfect Broker: Explore Our List Now!
Choose the best with our expert-selected options
Discover top binary options brokers tailored to your region. Browse our curated lists by country: