Updated:November 11, 2026

5 min

Trend Trading and Types of Trends
Trend trading means identifying the direction an asset is moving and taking positions in that direction. Identifying the trend is straightforward once you know what to look for, and entering it is where the decisions are. Updated September 2026.

Cory Mitchell
Author

Updated October 23, 2026
Trend trading means identifying the direction an asset is moving and taking positions in that direction. Identifying the trend is straightforward once you know what to look for, and entering it is where the decisions are. Updated September 2026.
The three environments
-
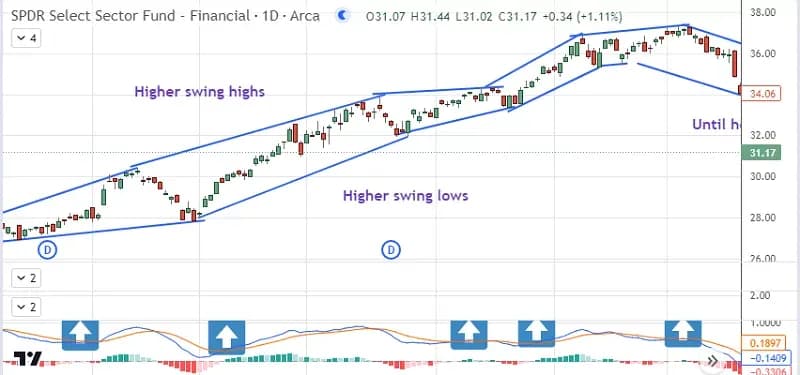
Uptrend: higher swing highs and higher swing lows
-
Downtrend: lower swing highs and lower swing lows
-
Sideways: no consistent progression in either, price contained within a range
A swing high is a peak on the chart, a swing low is a trough. No asset moves in a straight line, so the direction of the sequence matters rather than any single move.
Trends exist on every timeframe. A one-minute chart can show an uptrend while the daily chart is falling, so specify which timeframe you mean before calling a direction.
Identifying an uptrend
Price rises, pulls back, and rises again to a higher level than before. Connecting successive highs and successive lows shows both sequences progressing upward.
The trend remains intact while that structure holds. The first lower swing low is the signal that it may be ending, not the feeling that price has risen far enough.
Identifying a downtrend
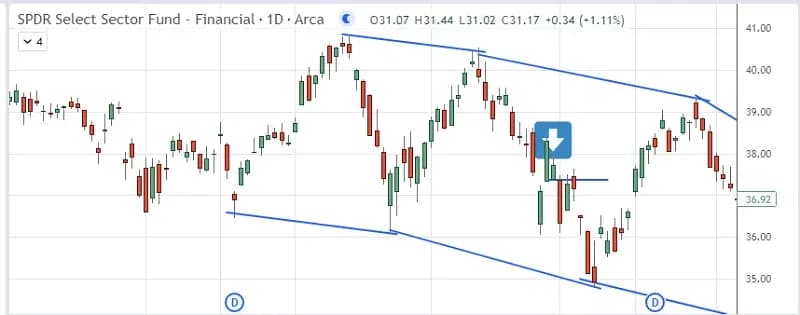
The inverse: each rally stops below the previous one and each decline exceeds the previous low. Lower swing highs and lower swing lows.
Identifying a sideways market
Price moves up and down without net progress in either direction, contained between a support level below and a resistance level above.
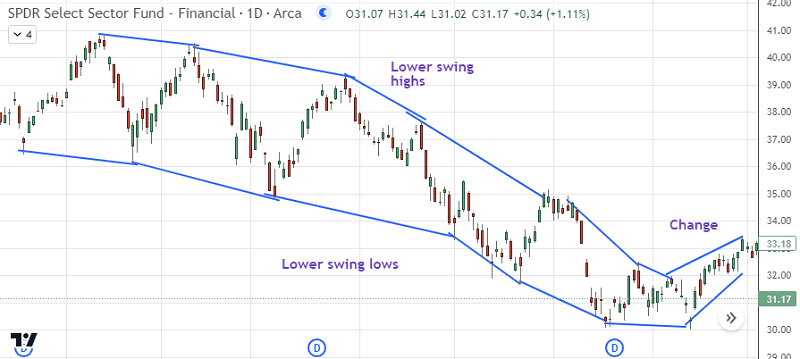
Characteristics of a Downtrend
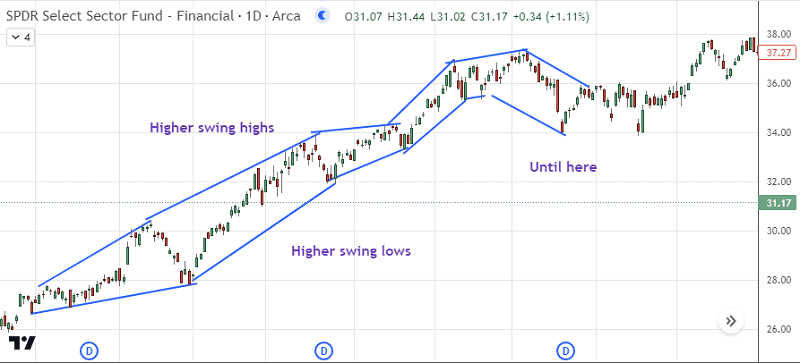
SPDR Select Financial Fund ETF (XLF)

What Are the Types of Trends to Trade?
Small trends still exist inside a range: price trends up to resistance, then down to support. What is absent is progression across those swings.
Method one: trading pullbacks
The most common approach. In an uptrend, wait for a pullback toward the rising sequence of lows and enter as price resumes upward.
The advantage is entry price: buying into weakness within a rising structure puts the stop close, below the most recent swing low, which keeps the risk small relative to the target.
The difficulty is distinguishing a pullback from a reversal. There is no way to know in advance, which is exactly why the stop goes below the last swing low: if that level breaks, the structure has changed and the trade is invalidated by definition rather than by opinion.
Method two: trading momentum
Entering as price moves strongly in the trend direction, rather than waiting for a pause.
This captures the fastest part of a move and avoids the risk that a pullback becomes a reversal. The trade-off is a worse entry price and a wider stop, since the nearest structural level is further away.
Momentum entries suit trending conditions with clear direction and perform poorly in choppy markets, where strong moves reverse within the same session.
Method three: trading new highs or lows
Entering as price breaks above the previous swing high in an uptrend, or below the previous swing low in a downtrend.
The logic is that a new extreme confirms the trend continuing. The risk is the false breakout: price clears the level, attracts entries, and reverses immediately.
Waiting for the breakout candle to close beyond the level, and checking that volume increased, filters out a substantial proportion of those.
Stops and targets
Stops belong at the level that invalidates the trade structurally. For a long in an uptrend, below the most recent swing low. For a short, above the most recent swing high.
Position size follows from that distance combined with your risk limit. The stop is identified first and the size calculated from it, not the other way round.
Targets can be fixed, using a multiple of the risk, or trailed by moving the stop up behind each new swing low as the trend progresses. Fixed targets capture a defined amount reliably. Trailing captures more from a sustained trend at the cost of giving back part of the gain at the end.
Practical points
-
State which timeframe you are trading before identifying the trend
-
Confirm the structure with at least two swing highs and two swing lows
-
Use pullback entries for the tightest stops, momentum entries for the strongest moves
-
Wait for a candle close beyond a level before treating a breakout as valid
-
Place stops at structural levels, then calculate position size from the distance
-
Stop trading the trend when the structure breaks, not when price feels extended
See related trading guides and compare charting platforms in our forex brokers section.
Trend trading: frequently asked questions
What defines an uptrend?
Higher swing highs and higher swing lows. The trend holds while that structure continues, and the first lower swing low signals it may be ending.
Which entry method is best?
Pullbacks give the tightest stops, momentum entries catch the strongest moves with wider stops, and breakout entries confirm continuation but risk false breaks.
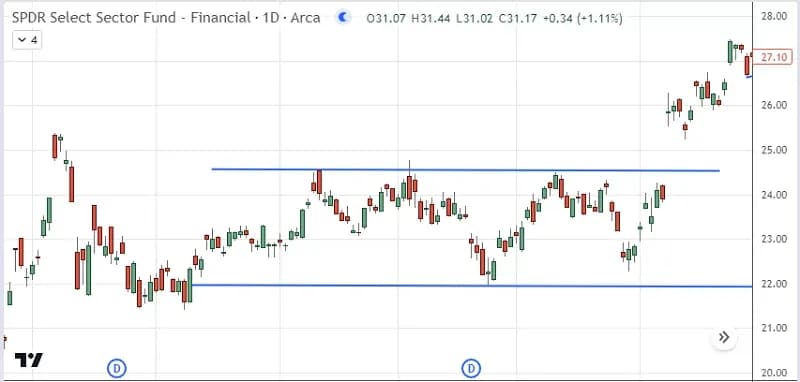
Characteristics of a Sideways Trend or Lack of Trend
How do I tell a pullback from a reversal?
You cannot in advance. That is why the stop sits below the last swing low: if it breaks, the structure has changed and the trade is invalidated.
Where should the stop go?
At the structural level that invalidates the trade, below the recent swing low for a long or above the recent swing high for a short.
Should I use fixed or trailing targets?
Fixed targets capture a defined amount reliably. Trailing captures more from sustained trends but gives back part of the gain at the end.
Can trends exist on different timeframes at once?
Yes. A one-minute chart can rise while the daily chart falls. Always specify which timeframe you are trading.

Trend Trading Exits (Stop Losses and Profit Targets)
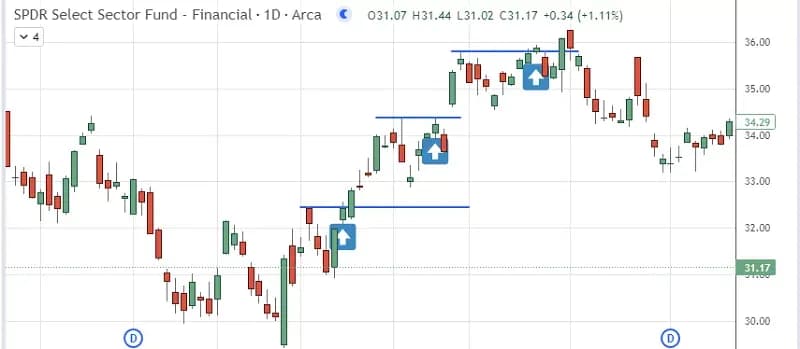
Trend Trading at New Highs or Lows
Trend Trading with Momentum
Trend Trading with a Pullback Method
Find Your Perfect Broker: Explore Our List Now!
Choose the best with our expert-selected options

Find Your Perfect Broker: Explore Our List Now!
Choose the best with our expert-selected options
Discover top binary options brokers tailored to your region. Browse our curated lists by country: