Updated:November 13, 2026

10 min

0
Understanding the ICT trading strategy: order blocks and FVG
The ICT trading strategy is a group of chart-reading concepts associated with the Inner Circle Trader, Michael Huddleston. Traders using these ideas watch liquidity sweeps, sharp price displacement, order blocks and fair value gaps. The terminology can sound technical, but most of it describes observable price behavior around recent highs and lows. The harder question is whether a specific combination produces repeatable results after realistic transaction costs. A well-labeled chart is not a backtest.

Ilya Samotolkov
Author

Updated November 13, 2026
ICT trading and smart money concepts: the core idea
ICT material presents a view of price in which clusters of stop orders and resting liquidity often sit near obvious swing points. Traders look for price to run through one of those levels, reverse or accelerate, then use areas left behind by the movement to plan entries. Smart money concepts, or SMC, is a broader label for many similar tools. Neither term proves that a particular bank or institution deliberately caused a candle to form.
A workable introduction begins with normal market structure. Find the current range, mark its obvious highs and lows, note the trading session and identify the trend. If those basics are unclear, adding advanced labels can disguise the uncertainty rather than resolve it. You need one consistent swing definition so the same chart does not receive a different explanation every time you review it.
Liquidity and the ICT liquidity sweep
Buy-side liquidity is often discussed around visible highs where buy-stop orders might rest; sell-side liquidity is discussed around visible lows where sell stops may cluster. A liquidity sweep describes price trading beyond one of those levels. Traders sometimes treat a rapid return inside the range as evidence of a failed breakout. The sweep itself does not guarantee a reversal. Strong momentum can simply continue through the same level.
How to mark a sweep without guessing
On a 15-minute chart, mark a prior session high and low before the market reaches them. Wait for price to trade beyond a marked level. Record whether the candle closes back inside and whether a subsequent swing breaks in the opposite direction. That sequence is more specific than labeling every wick a stop hunt. It also makes the idea testable using candles that were available at the time.
An obvious mistake is seeing a large wick after a reversal and drawing the liquidity level backward to fit the story. Pre-mark levels and keep the screenshots. If the expected stop cluster was never defined in advance, the trade cannot honestly be counted as a planned liquidity sweep.
Displacement and market structure shift
Displacement generally refers to a forceful price move, often with relatively large candle bodies and less overlap than the surrounding bars. It may follow a liquidity sweep, economic release or sudden change in order flow. A market structure shift describes a break of a recent swing in a direction suggesting that the short-term sequence has changed. The validity of that label depends on how the swing was defined.
A simple market structure example
Suppose price takes out a local high near 1.0850, falls sharply and closes below the last short-term swing low at 1.0820. An ICT trader might read the high sweep followed by bearish displacement as a possible change in short-term direction. That is still only an interpretation. If price immediately regains 1.0850, the bearish thesis is in trouble. A plan needs to specify what constitutes failure before an order is placed.
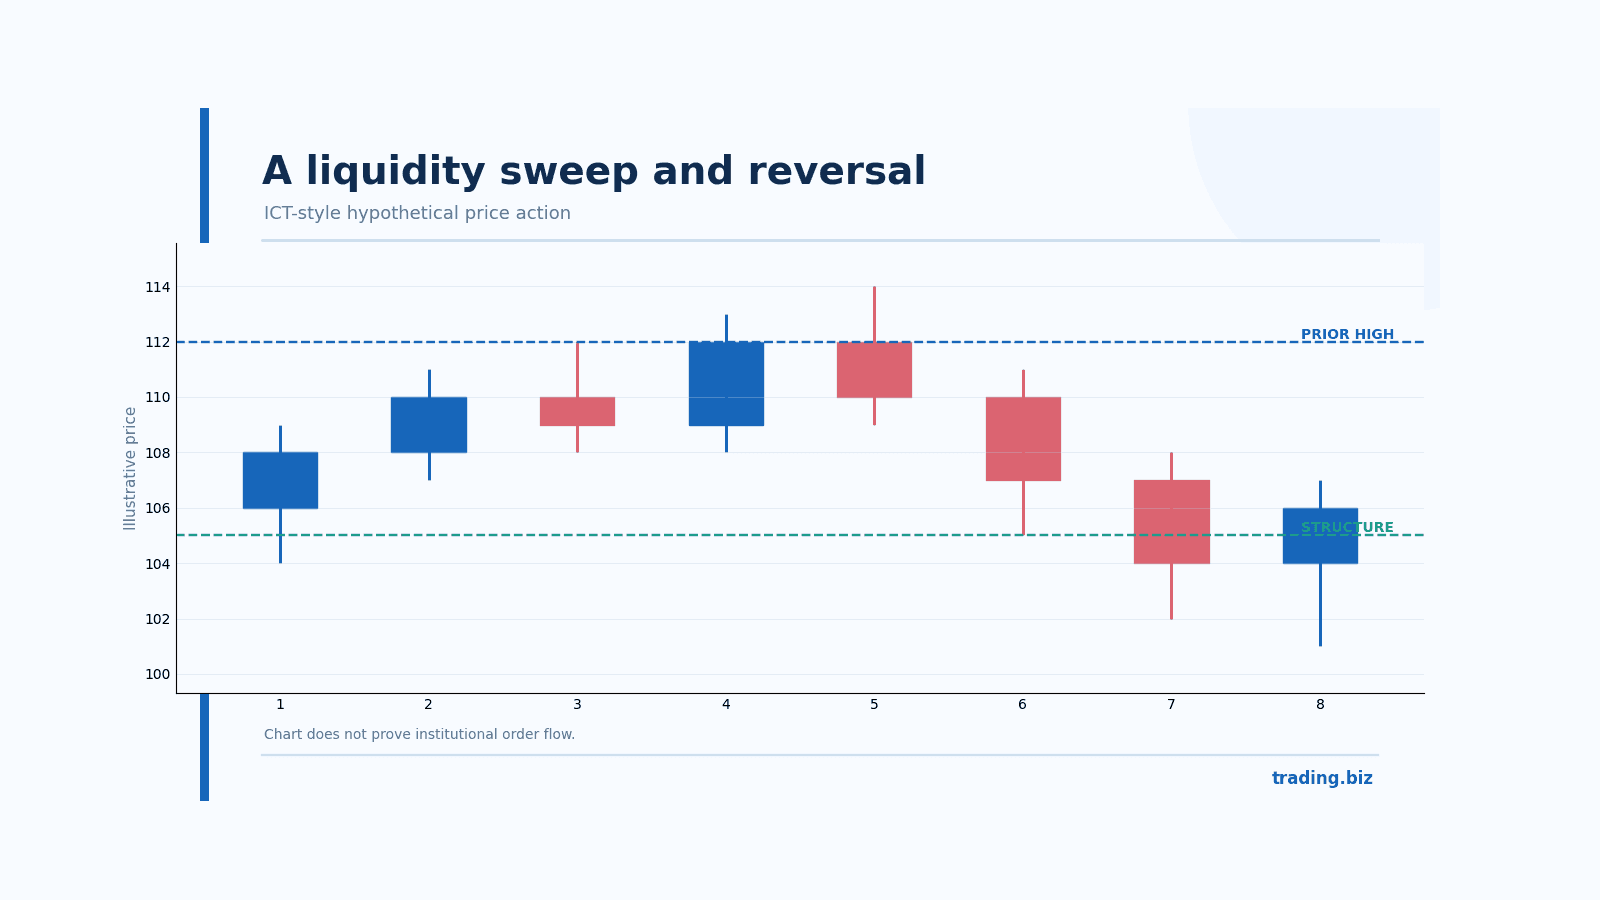
Figure 1. An example of a high sweep followed by a structure break.
Market structure can change at multiple scales. A bearish five-minute shift might be only a minor correction inside a bullish four-hour trend. Decide which timeframe sets the directional context and which sets the entry. Switching timeframes to rationalize a losing trade turns the method into an unfalsifiable story.
ICT order blocks: how to mark and use them
An order block is commonly described as an area around the final opposing candle before a strong move that breaks structure. In the bullish version, traders may mark the last bearish candle before an upward displacement; in the bearish version, the last bullish candle before a decline. Exact definitions differ across ICT educators and traders. No public chart can prove which particular institution placed orders inside that candle.
Trading a return to an order block
After a bullish shift, a trader may mark the selected candle range and wait for price to retrace into it. An entry requires more than the zone touching price. The plan should specify an acceptance or rejection signal and a stop below a meaningful invalidation level. The next opposing liquidity area or swing high might serve as a target, but the potential reward must justify the risk and cost of entry.
Order blocks can fail repeatedly, especially in choppy sessions. Some traders mark so many zones that price is always "inside an order block." Limit your chart to zones that satisfy a consistent displacement and structure rule. If every candle counts, the concept has lost its usefulness.
Fair value gap (FVG) in simple words
A fair value gap is a three-candle price imbalance under common ICT definitions. In a bullish pattern, the low of the third candle is above the high of the first, leaving a visible price interval that the middle displacement candle crossed without overlapping wicks from the outer candles. The bearish pattern reverses those relationships. It is an observation about candle ranges, not proof that all orders in that price band were unfilled.
A trader may watch for price to revisit the interval and react. Some gaps are never revisited. Others are filled immediately and price continues through. The words "fair value" do not mean the market owes a trader a return to that price. Without a rule for which gaps matter, the method can become selective storytelling.
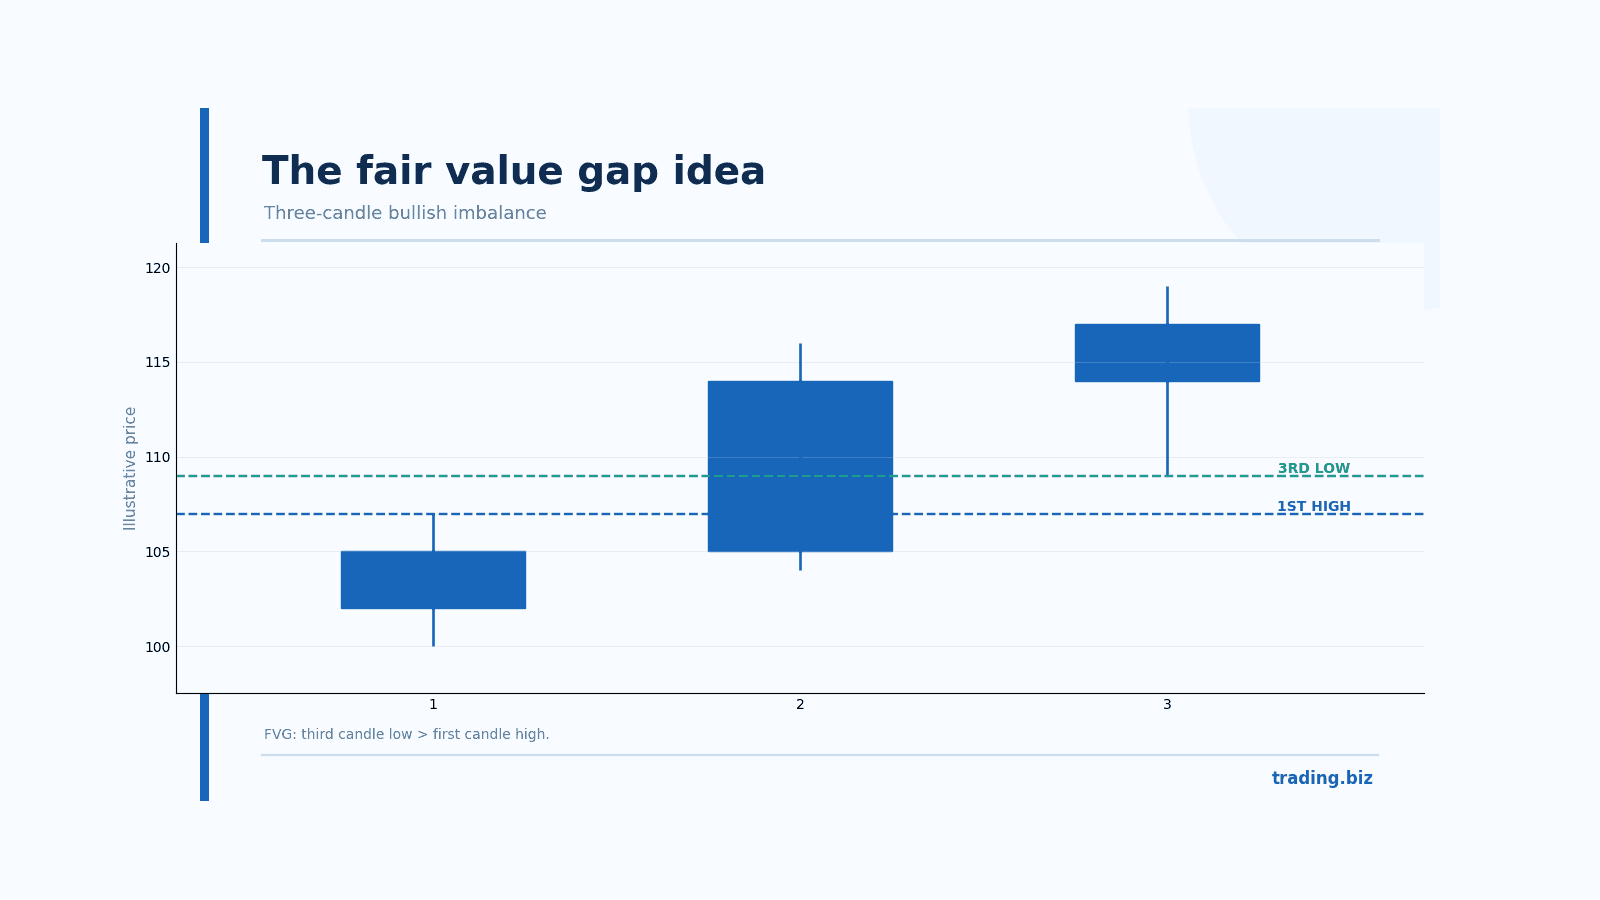
Figure 2. The candle-range relationship used to identify a bullish FVG.
FVG entry and stop logic
Suppose a bullish gap runs from 1.0800 to 1.0815 after an upward structure shift. A trader might plan to consider a long only if price pulls into the interval and displays renewed buying. A stop under the swing low could be far enough away to require small position size. Buying every touch of the midpoint is another strategy altogether and should be tested separately.
Building an ICT trading strategy: one example setup
Here is a hypothetical sequence that a trader can actually test. First, mark the previous day's high and low. During a chosen session, wait for a sweep of the prior low. Second, demand a close above a clearly defined short-term swing high with displacement. Third, identify a bullish fair value gap created during that move. Fourth, consider entry on a retracement into the gap only if the structure remains intact. Place the stop beyond the swept low, size the position from that distance and decide on a target before entry.
The reverse setup applies to a sweep of the prior high followed by a bearish shift. Do not assume both directions are equally profitable in every market. Session timing matters because spreads and liquidity differ between London, New York and quieter hours. Document the exact session clock, including daylight saving changes, before collecting statistics.
What should count as a valid test?
Use the same definition of a swing, sweep, displacement and FVG for every candidate. Log trades that never retrace, trades that trigger and fail, and trades that would have required impossible fills. Measure net result in units of initial risk after spread, commission and slippage. Split your data into a development set and a later untouched period. A technique tuned on the same historical sample you report as evidence is likely to look better than it really is.
Why ICT concepts attract criticism
Many patterns are defined with enough flexibility that a persuasive narrator can find them in almost any chart after the fact. The explanations may attribute moves to institutional motives that a retail chart cannot verify. That does not prevent a clearly defined rule set from being tested. It means the evidence must come from trade records, not from confident language about what "smart money" must have done.
Limits of an ICT and SMC trading approach
Expect failed sweeps, overlapping gaps and rapid reversals. A supposed reversal can be a pause before another strong trend leg. Traders also underestimate the impact of execution. A five-minute setup near a macroeconomic release can have a beautiful entry on a historical chart and an untradeable spread in real time.
Keep the chart clean and the rule set narrow. If the setup is not present, leave it alone. A trader who needs a new concept every week may be trying to avoid measuring the old one. The method becomes useful only after the rules are stable enough that another person could mark the same examples without relying on your hindsight.
Premium, discount and the idea of trading range location
Some ICT traders divide a selected dealing range at its midpoint. Prices in the upper half are described as premium and those in the lower half as discount. The terminology is useful only after the endpoints of the range are defined. Move the endpoints after every new candle and the labels can be made to justify almost any position. Choose a daily or session range in advance and keep it fixed for the test.
The range midpoint is a reference, not an exchange-calculated fair price. A strong trend can remain in the upper half for many sessions without offering a short. Use the location as one filter within a documented setup rather than treating it as a command.
Kill zones and time-of-day bias
ICT material places special emphasis on certain active market windows, often called kill zones. Their appeal is practical: liquidity and volatility differ by session, and the London or New York open can produce moves that a quiet overnight range does not. The specific hours should be translated into the trader's local time with daylight saving changes accounted for.
Test session-based filters with the same caution as any other variable. If a setup seems profitable only during one narrow historical window, see whether it holds up in a later year. More parameters do not automatically mean more precision; they may merely make the rules better at fitting one period of data.
Choosing one test rather than collecting every concept
A clean starting hypothesis might be: after a sweep of yesterday's low during an active session, enter on a confirmed return into the first bullish fair value gap only if a short-term structure shift has occurred. That still needs exact swing definitions, a stop, target and skip conditions. The benefit of a narrow rule set is that fifty trades can be reviewed without inventing a new explanation for every outcome.
Record how often the setup appears, not only how often it wins. A strategy that produces four trades a year cannot reasonably support assumptions about steady weekly income. Track the time required to monitor it as well. The best historical-looking pattern may be impractical if it requires watching every candle for twelve hours a day.
FAQ about the ICT trading strategy
What does ICT mean in trading?
It refers to the Inner Circle Trader approach associated with Michael Huddleston. The material uses concepts such as liquidity sweeps, order blocks, market structure shifts and fair value gaps.
Does a liquidity sweep always reverse price?
No. Price may continue past the high or low. A sweep is an observation, not a confirmed directional signal. Many traders wait for a structure shift before considering an entry.
Is a fair value gap guaranteed to fill?
No. Some gaps are revisited, others remain open for long periods, and many do not produce a useful trade on the return.
Can an order block prove where institutions bought?
No. A candlestick pattern cannot identify the orders or intent of a particular institution. The order-block label is a trading convention with differing definitions.
Is ICT trading suitable for beginners?
The terminology can overwhelm new traders. Learn support, resistance, order types and risk sizing first; then test one narrowly defined ICT setup on demo before risking money.
Official reference: CME market education
Find Your Perfect Broker: Explore Our List Now!
Choose the best with our expert-selected options

Find Your Perfect Broker: Explore Our List Now!
Choose the best with our expert-selected options
Discover top binary options brokers tailored to your region. Browse our curated lists by country: