Updated:October 12, 2026

10 min
10 min

In this article, I will be showing you how I installed the Heiken Ashi Indicator and how I used it. I will also show you a suitable Heiken Ashi trading strategy you can use.

Author

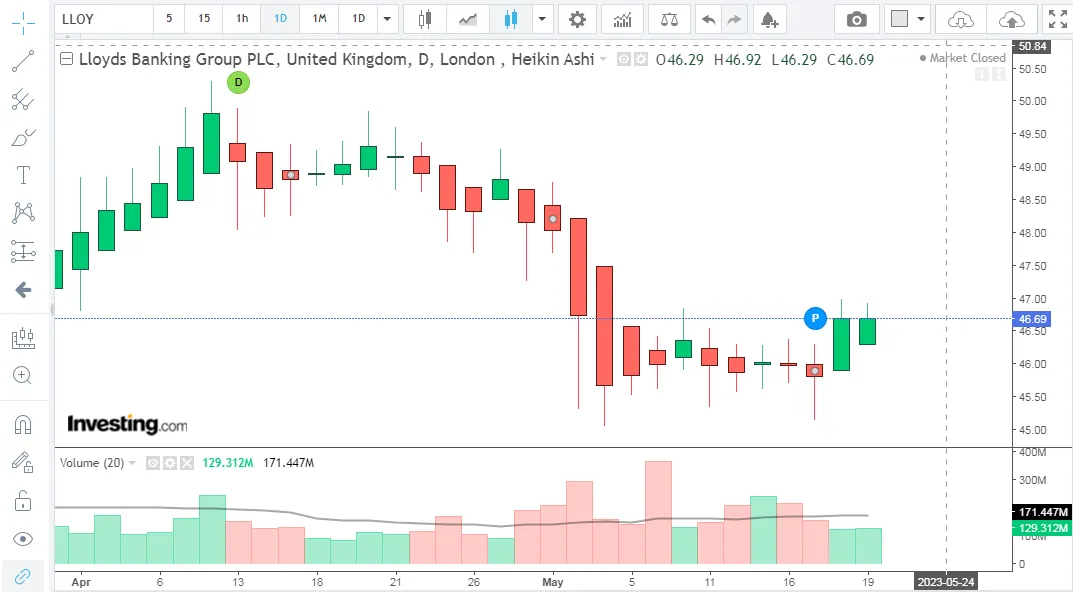
The Heiken Ashi trading indicator is a work of art. This daily chart makes market trends easier to understand, as it simplifies the fast-moving forex market into something less complex.
Although there are a lot of trading instruments on the market, you can only profit when they make profitable trades. Moreso, being a successful trader isn’t a walk in the park. This means that you’ll also have to possess the ability to identify profitable markets.
Steve Burns also believes the same, “There is a huge difference between a good trade and good trading.” For this purpose, many traders have accrued many technical indicators.
However, you can only identify a profitable market when you use the proper technical analysis tool for a trading instrument. This could be trading robots, brokers, etc. Therefore, even when binary options trading looks simple enough, everyone is advised to use a trend instrument.
Unfortunately, using a trend instrument when you are new to the forex market is a disaster. For someone like me who is new to trading, a typical candlestick chart looks complex. I can’t comprehend the price movements on a regular candlestick chart.
Introduced in 2004, Heiken Ashi is a charting type that investors use to analyze the trend indicators in the trading market. It’s purported that this candlestick is the re-invention of the trading chart of Munehisa Homa, a Japanese rice farmer. This 18th-century farmer used their chart patterns to analyze the future trading prices of the rice market.
Today, the Heiken Ashi candle enhances overall signal development and eliminates false breakout signals. It works with the average price values from two time periods.
As such, this chart type is a better trade indicator than traditional candlestick charts. In addition, this candle uses long-term data to update its price chart so that you can be sure of a more substantial price trend.
Heiken Ashi candles are great for dispelling false signals and cutting through all the market noise. Unfortunately, this market noise was the culprit responsible for the complex nature of standard candlestick charts. This is because they cause the charts to move according to every current trend in the market.
Nonetheless, the ability to cut out all the market noise makes the charts pay attention to only strong price action. This makes Heiken Ashi candles a good choice for predicting long-term binary options trends.
The breakouts you get from the Heiken Ashi candles are data collected over a more extended period. So, I concluded that the Heiken Ashi trading strategy mostly focuses on long-term price trends. However, this also indicated a disadvantage you wouldn’t see in typical candlestick charts.
This disadvantage is that this Japanese candlestick chart misses short-term price fluctuations. So, this candle might not work too well for binary options, which are short-term trading instruments. However, I changed my mind after using it for day trading, as it offered satisfactory results.
While using the Heiken Ashi candles, I noticed that they do not display signals like daily closing prices or price gaps.
I was surprised to discover that Heiken Ashi candles are one of the popular chart types. They’re not obscure, but most traders don’t use them. So, if you want to use this trading candle, you’ll probably find it on any standard trading platform. Click on the “Candle” icon, to see it there.
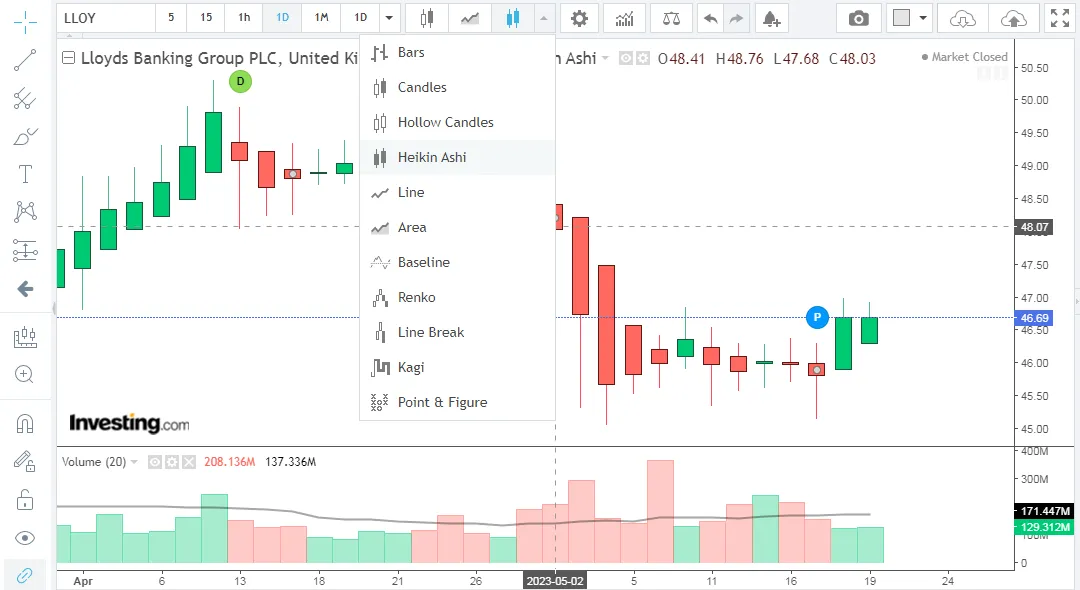
Below is a simple guide I wrote on how to set up this candle pattern on any trading platform.
Heiken Ashi works like the traditional candlesticks that you see on your trading platform. Apart from the fact that it shows more vital market trends, there are no differences. Now that you’ve set up this indicator, I will show you how to read it.
When using the Heiken Ashi indicator (or any trading indicator), you’ll come across three trading possibilities:
I’ll show you how to read these trading possibilities whenever they appear and what you should do to make a profit.
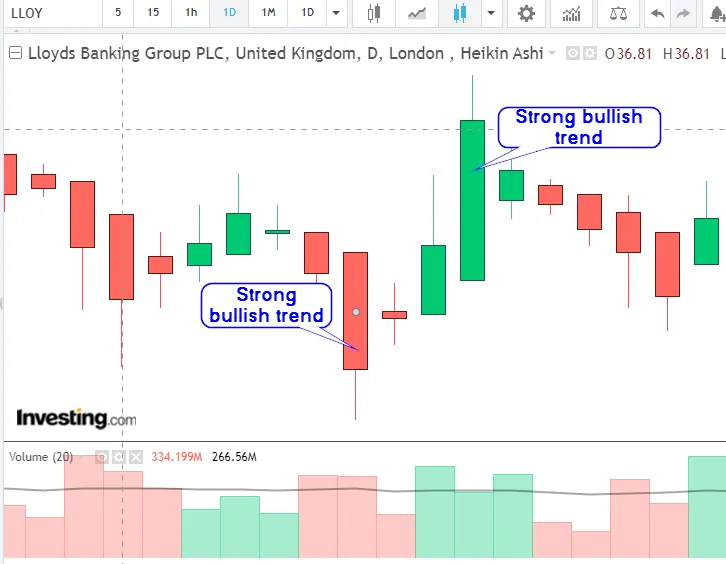
A long, filled candle identifies major trends in the financial markets with little or no shadows. A bullish trend is indicated by the green candle, while a bearish trend is indicated by the red candle.
Rob Smith once said, “Buy things that are going up. Sell things that are going down. And when they stop, get out!” Ironically enough, this applies well to this trading indicator. The bullish trend is a good “buy” indicator, while the downward trend is a good “sell” indicator.
This means you can open a short-term trading contract during this time frame. This trading contract can last from 2 minutes to 60 minutes.
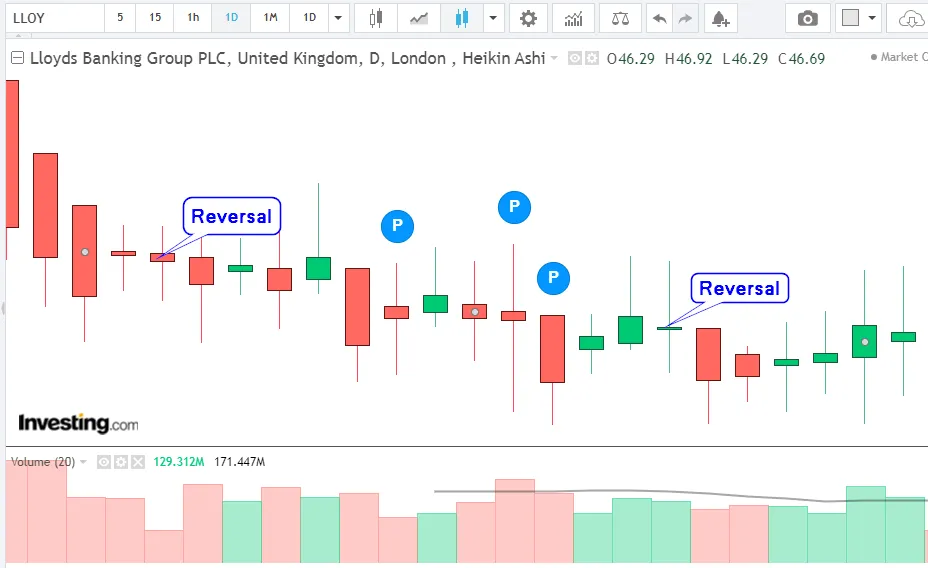
A candle indicates a reversal with a short body and long shadows above and below the candle. Relapses take time to occur, so they’re best suited for a medium-term trading contract. However, you’ll enjoy better accuracy when you analyze the historical price data to ensure that it’s a reversal.
Strong trends and reversals are easier to spot, while sideways movements are more complex. This one requires extra tools, unlike the other trading possibilities that work with just the trading indicator. It also requires you to use a binary options trader that supports it.
Sometimes, sideways movements can also be confused with false movements. So, you cannot use the Heiken Ashi indicator alone; you’ll have to pair it with other tools.
Some tools you can use for sideways movements include the Relative Strength Index (RSI) and Bollinger bands. In addition, sideways trading, characterized by a lack of volatility, is perfect for short to medium-term trading contracts.
Many of you probably still wonder, “Why the Heiken Ashi Indicator?” Besides the fact that they are easier to read, I uncovered a few more advantages of this candle.
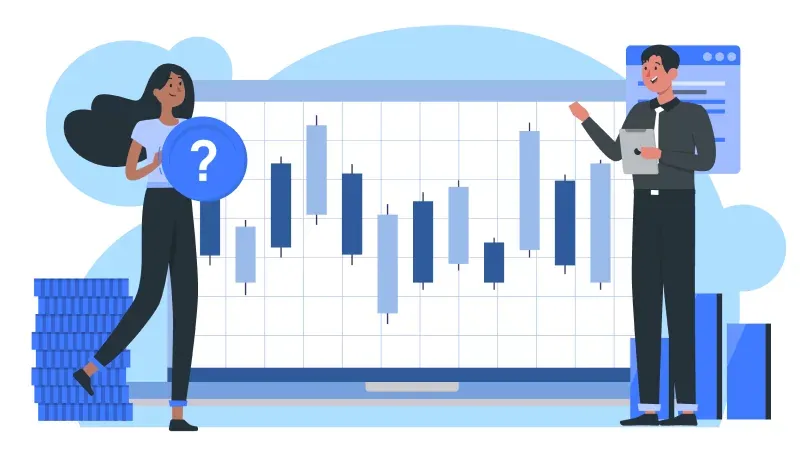
The best Heiken Ashi indicator is one of the most basic one. So, it requires no trading skills, which makes it great for beginners in the trading market. But, of course, a wide range of experienced traders still use this candle.
You’ll find this indicator on all trading platforms. So you can use it on the most basic platforms to advanced MetaTrader 4 and Meta Trader 5 platforms. As such, you won’t need to stress yourself trying to download or set up complex plugins.
This indicator doesn’t just work for binary options trading; you can also use it in other trading markets. So, you can use it for leveraged forex, cotton futures, or spot BTC. I noticed that the Heiken Ashi indicator is great for eliminating false signals.
The Heiken Ashi indicator has a broader range of data than most trading indicators on the market. This means that false breakout signals can be singled out with ease.
This indicator works well alone, but you can also increase its capability by combining it with other indicators. This way, you can analyze more complex indicators and even compensate for their inability to indicate short-term signals.
Although the Heiken Ashi indicator can help newbies to make good decisions for binary trading, it could be better. There are a few disadvantages that I have seen when using this indicator, and they include:
While the Heiken Ashi indicator offers an accurate range of significant data, it doesn’t provide much real-time data, like actual price levels. This simplicity makes it usable for newbies to the trading scene but also makes it somewhat inefficient.
Heiken Ashi candle indicators are geared towards long-term trading plans. However, it is bad for short-term trading strategies, as it can’t capture short-term price momentum. As a result, this property might make day traders miss out on potential trading opportunities.
Many traders use price gaps to capture price movements and make better predictions. However, the Heiken Ashi candles indicator doesn’t capture price gaps. So, it’s terrible for traders who are used to this trading style.
The Heiken Ashi candle pattern indicator works with an averaging effect. So, price data is lost when working with this indicator.
While using the Heiken Ashi indicator, I also came across the Heiken Ashi smoothed indicator. The Heiken Ashi smoothed indicator is a modified variant of the traditional Heiken Ashi candle.
While many people consider it a better technical tool than the original, you can’t use it. A smooth Heiken Ashi indicator is included as an overlay on the traditional Heiken Ashi indicator. So, the Heiken Ashi smoothed indicator plots the original one as a moving average.
After using it, I concluded that this modified Heiken Ashi candle works like the original. Bullish trends are indicated by green candles, while downward price trends are indicated by red candles.
Trading with this indicator is similar to the original, as the trend directions are the same. Two or more green candles in one direction indicate an upward trend and a “buy” signal. Two or more red candles in one direction indicate a downward momentum and a “sell” signal.
The Heiken Ashi trading strategy is a good option to eliminate noise and false signals when trading BO. This indicator is also a beginner-friendly candle that’s easy to use and supported by all major trading platforms. It analyzes the upward and downward trends for BO, forex, and other trading instruments.
For the best results, you’ll need to combine this indicator with other indicators like Bollinger bands and moving averages. These extra indicators would cover some shortcomings that I noticed in Heiken Ashi.
Find Your Perfect Broker: Explore Our List Now!
Choose the best with our expert-selected options
Find Your Perfect Broker: Explore Our List Now!
Choose the best with our expert-selected options
Discover top binary options brokers tailored to your region. Browse our curated lists by country:
16197