Updated:October 13, 2026

10 min
10 min

Have you ever seen a natural diamond? In this article, I want to show you the market diamond. A diamond that is equally valuable and equally beautiful. But to find this diamond, we don’t need to go deep beneath the earth’s surface; we just need to search among the candles.

Author

The Diamond pattern forms at the top and bottom of the market and causes a trend to reverse. This pattern is not as common as other chart patterns; as I said, this pattern is like a diamond, rare and brilliant. But if you find it in the chart, you guarantee your profit.
Yet its value and rarity are not what earned it the name ‘Diamond pattern’. We call it the Diamond pattern because it resembles a diamond on the chart. The human eye likes to see patterns in nature and wants to see nature in patterns. This is why trading patterns are named ‘Head and Shoulders,’ ‘Diving Board,’ etc.
I have terrific memories of this pattern because even though it is not as common as other chart patterns, it has a lot of power, and my win rate is very high when using it. One of the best positions I traded using this pattern involved the most famous coin in cryptocurrency, Bitcoin. In this position, I made 20% of my monthly profit target.
Of course, the Diamond pattern is not always a reversal pattern; sometimes, it is also a continuation pattern. I will show you profitable strategies for both types. In addition to the Diamond pattern, I will teach you other ways to increase your win rate. So stay with me until a precious diamond is added to your knowledge.
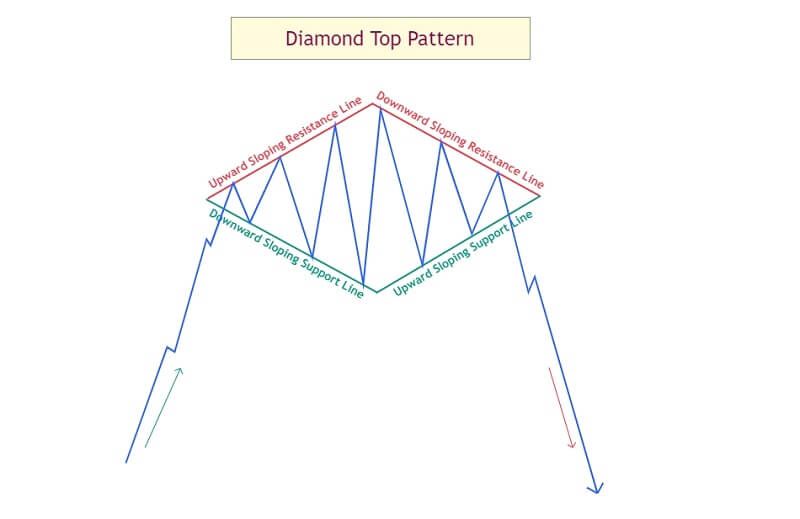
The Diamond Top pattern is a bearish reversal pattern. It forms at the end of an upward trend and causes the price to reverse downward. The Diamond Top pattern is used to detect this market reversal and is a signal to exit from positions in one-sided markets. But in two-sided markets, we can open a short position and make a profit.
This pattern is very similar to the Head-and-Shoulders pattern but instead of a neckline, there are two sloping support lines below the pattern and two sloping resistance lines above it. At first, the price has a lot of swings and makes lower lows and higher highs, which is a sign of confusion between bulls and bears.
Then the fluctuations decrease, and higher lows and lower highs are made. In this case, a Diamond pattern forms; a strong signal that the market will reverse. Not every diamond is authentic but some confirmations exist to indicate those that are.
Trade the Diamond Top Pattern
When the lower support line breaks, we can open a short position. But be careful that the candle breaking the support line is a valid breakout candle. A breakout candle should close below the support trend line because it can be a fake breakout and our analysis will be wrong.
I have talked about valid breakouts in previous articles, so you know what I mean. In the standard mode, you should set your stop-loss above the highest price of the pattern. But this depends on your personal money management strategy; you can place it above the last top or above the pattern’s highest price.
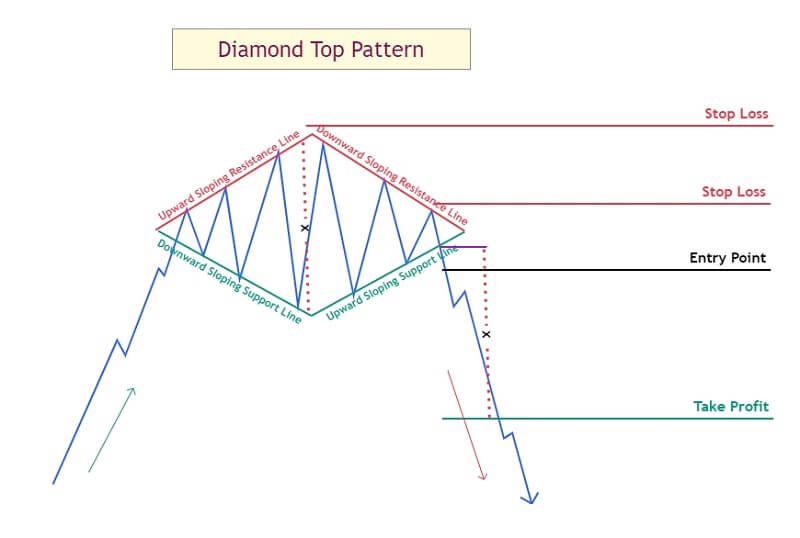
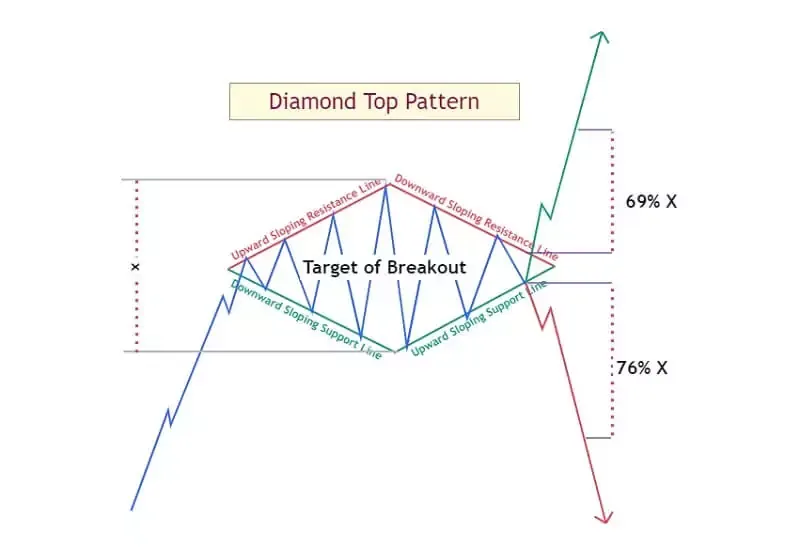
The take-profit level is equal to the distance from the highest peak to the lowest bottom of the pattern (see X lines on the above chart). Pay attention to this position on the ADAPERPUSDT chart in a 2-hour time frame.
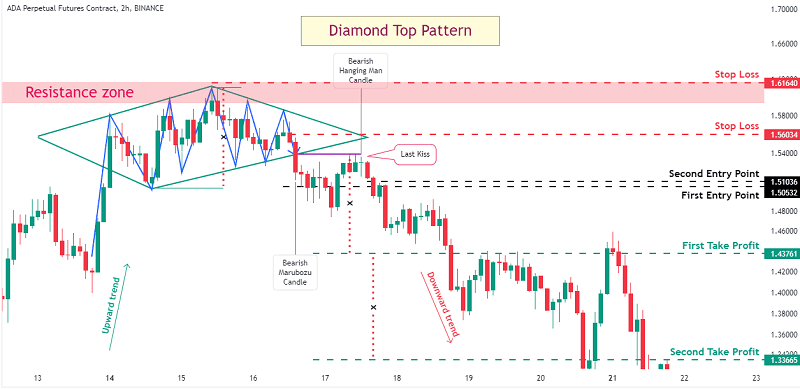
In this pattern, when the price broke the lower support trend line with a breakout candle and the candle closed below the support trend line, I entered the position at 1.50532USDT and set my stop-loss above the highest price of the candle at 1.56034USDT.
I used a candlestick pattern and set my stop-loss above it because it gave me a higher risk-to-reward ratio. When the price pulled back to the breakout area and the last kiss formed, I entered the second position at 1.51036 USDT with the confirmation I got from the candlestick hanging man pattern.
I used the distance from the highest peak of the pattern to the lowest bottom for the first take-profit level, which I set at 1.43761 USDT. My first position was closed at the first target, and my second position remained open until the second target level was reached, which was twice the first target. In this position, I made a profit of $2,750 while my stop-loss position was only $1,200.
The Diamond Bottom pattern is a bullish reversal pattern. This pattern forms at the end of downward trends and causes the price to reverse into an upward trend. Unlike the previous pattern, this pattern is very useful in one-sided markets because it forms at the bottoms, and we can use it for long positions.
This pattern is very similar to the inverse Head-and-Shoulders pattern, but in this pattern, instead of the neckline, we have two sloping resistance lines at the top and two sloping support lines at the bottom of the pattern. Again, the shape of this pattern is very similar to a lozenge or diamond.
To form this pattern, the price first experiences several fluctuations and makes higher highs and lower lows. Then, the fluctuations decrease, and the price makes lower highs and higher lows.
If the price reverses upward, we open a long position and set the stop loss below the lowest price of the pattern. We can also consider the take-profit level as being the same distance as that from the highest peak to the lowest bottom.
The diamond bottom pattern is sometimes confused with the rounding bottom pattern because they are very similar. Of course, if you read the article on rounding bottom, you will understand that these two patterns are different, and the only similarity is that both patterns are valuable.
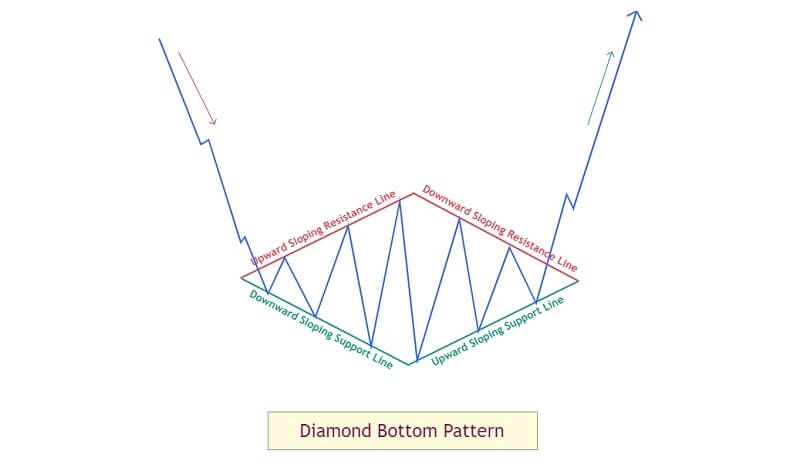
Trade the Diamond Bottom Pattern
When the price breaks the upper resistance area, I open a position. In standard mode, you should set your stop-loss below the lowest candle of the pattern. Of course, this depends on your risk management; you can set it below the last and highest low or below the lowest price of the pattern overall. But if you are looking for a higher risk-to-reward ratio, you can set your stop-loss below the breakout candle.
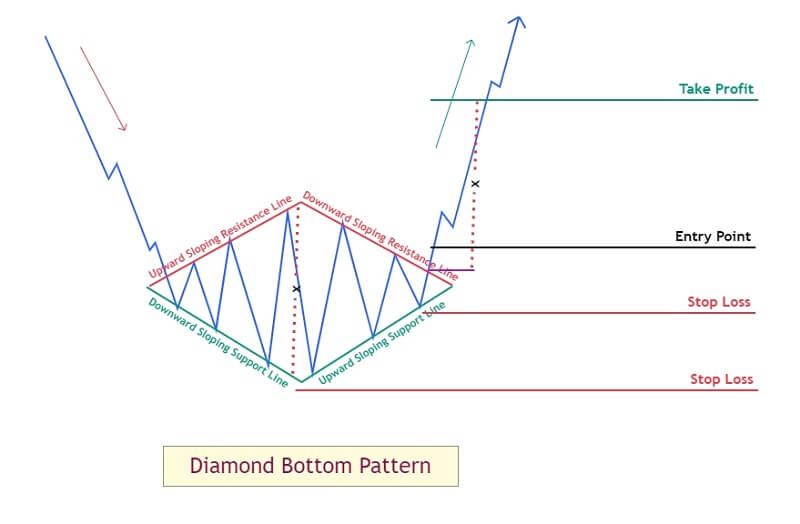
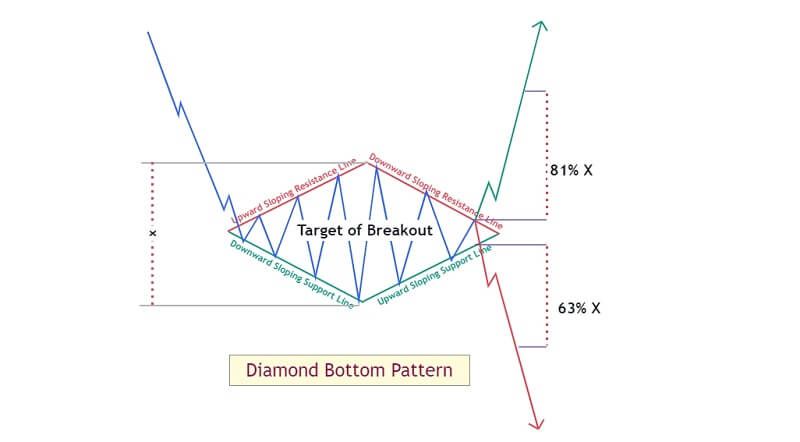
The standard take-profit level with this pattern is equal to the distance from the highest peak to the lowest bottom of the pattern (again, see X lines on the above chart). I want to show you one of the trades I made on BTCUSDT in a daily time frame, using the Diamond Bottom pattern, from which I made a good profit.
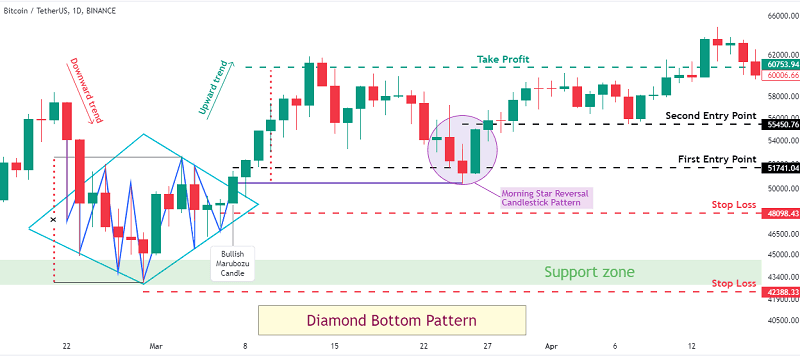
The resistance line was broken by a breakout candle, and I entered the first position a little higher than the last price of the breakout candle at 51741.0 USDT. My take-profit distance was equal to that from the highest peak to the lowest low.
And I placed it at 60753.94 USDT. For the second position, I entered at the last kiss. But I needed confirmation so I waited for a reversal candlestick pattern to form.
A Morning Star candlestick pattern formed in this area and I decided to open a second position. I opened that second position at 55450.76 USDT and had the same stop-loss for both positions. I placed my stop loss below the lowest price of the breakout candle; at 48098.43USDT. Alternatively, I could have set my stop-loss below the last bottom of the pattern.
Fortunately, I made a profit of $5,100 on these positions. Enough to buy a real diamond. A small one, perhaps, but a diamond is a diamond. If you try hard, you could earn enough to afford bigger diamonds and have a good life; just learn and practice.
For more information about the technical analysis of Bitcoin, I suggest you read the article “The king of cryptocurrency; will Bitcoin rise again? (Bitcoin Road map)“.

I don’t want much confirmation for this pattern because the Diamond pattern is rare. Most of the time, I enter at the break of the support/resistance line because I don’t want to lose my chance to profit. But these are interesting points to know.
Be careful not to enter the position until the price does break the resistance or support line. Because the price may fluctuate and your stop-loss could be triggered. Always try to be patient when seeking to profit.
If the price does not reach its target after 50 candles, it is better to close the position because the price will not reach your take-profit level. If the Diamond pattern forms after a trend with high momentum, the probability of reverse increases. But not all Diamond patterns should be traded.
For confirmation, you can use other components of technical analysis, such as oscillators and candlestick patterns, etc. I have given additional explanations about this subject in previous articles.
Thomas Bulkowski had interesting results in 2005 with his research on the Diamond pattern. He increased the accuracy of analysis of the Diamond pattern.
Diamond Top Pattern
According to Bulkowski, following a Diamond Top pattern, the price reverses 69% of the time and continues its trend 31% of the time. Because 69 is much higher than 31, we still consider this pattern to be a reversal pattern. But I want you to have a plan when this pattern appears as a continuation pattern so that you can make a profit.
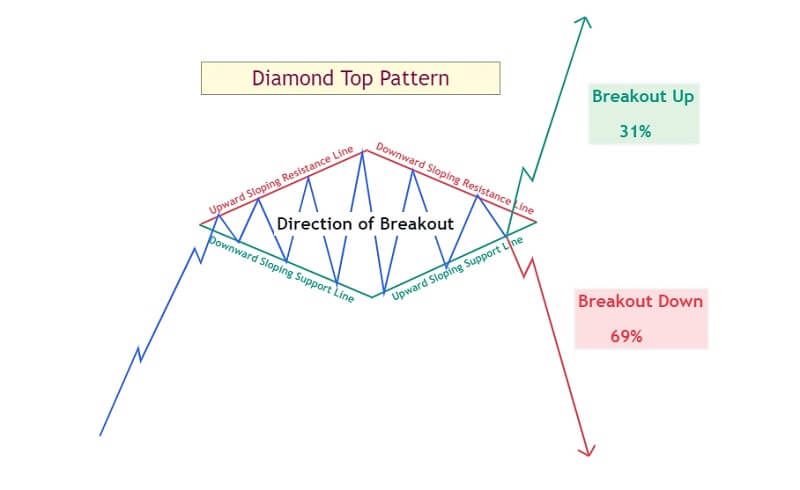
I told you that our profit target usually involves the same distance as that from the highest peak to the lowest low of the Diamond pattern. But Bulkowski optimized that target.
When the price passes the lower support trend line and goes down, the profit target is 76% of the distance from the highest peak to the lowest valley. But when the price crosses the upper resistance trend line and continues, the profit target is 69% of the distance from the highest peak to the pattern’s lowest valley.
Diamond Bottom Pattern
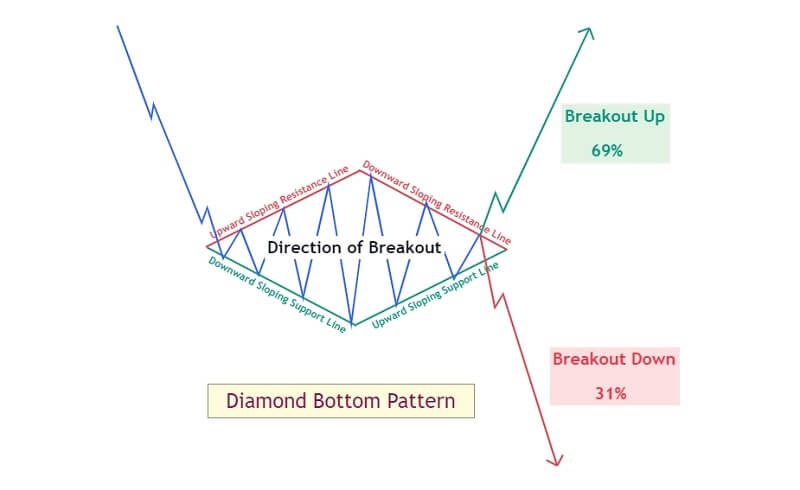
Bulkowski also did extensive research on the Diamond Bottom, which I want to explain to you. According to Bulkowski’s research, 69% of the time, the price reverses and enters an upward trend after the formation of the Diamond Bottom pattern. And 31% of the time, it continues its downward trend and becomes a continuation pattern.
He also obtained results for the targets of this bullish reversal pattern. When the price passes the upper resistance trend line and goes up, the profit target is 83% of the distance from the highest peak to the lowest valley. But when the price continues its downward trend after the formation of the pattern, the price target is 63% of the distance from the highest peak to the lowest valley.
In this article, you learned about the fantastic Diamond pattern. Be sure to practice the tips I told you and try to use them in your daily analysis. Repetition is the most critical factor in being profitable.
If you knock on a door every day, one day that door will open to you. Observe capital management in your daily positions and try to be orderly in your work. Discipline is the key to success. Thank you for joining me in this article.
Find Your Perfect Broker: Explore Our List Now!
Choose the best with our expert-selected options


Find Your Perfect Broker: Explore Our List Now!
Choose the best with our expert-selected options
Discover top binary options brokers tailored to your region. Browse our curated lists by country:
3047