Updated:September 23, 2026

5 min

3651
Gold Surges Toward $5,500 Amid Global Economic Risk

Saqib Iqbal
Author
The gold spot price remains underpinned, steadily climbing towards its all-time high of around $5,500. Investors are rushing to the precious metal amid a backdrop of geopolitical worries and economic instability.
The precious metal fell more than 5% from the all-time highs marked on April 22. The downside emerged as the markets exhibited improved risk appetite amid temporary relief from Trump's tariffs. However, several factors continue to drive the price of gold on a bullish trajectory.
Economic and Policy Factors Driving Gold Toward $5,500
Several factors indicate a bullish continuation of gold, potentially leading to a test of its all-time highs. Primarily, central banks around the world are easing to combat the slowdown in growth. Moreover, Trump's tariffs may also weigh on risk assets and provide a cushion for safe-haven gold bullion.
Rate Policy and Inflation Expectations Support the Trend
Central banks around the world have eased their monetary policies. At the top is the European Central Bank, which has delivered eight consecutive rate cuts, dropping interest rates by 2%. The Bank of England also followed a similar path, albeit with less intensity. In the last meeting, the Bank of England paused its rate cuts for a while to assess the economic outlook before continuing further.
The Federal Reserve also sent a slightly hawkish signal by reaffirming its intention to implement two rate cuts by the end of 2025. However, the Fed Chair noted that inflation concerns are not yet over, as the current inflation rate remains far above the targeted 2% level. Furthermore, recent concerns about tariffs could lead to inflation rising once again. Hence, the Federal Reserve is interested in seeing a continued decline in inflation and the labor market before considering a rate cut.
With no clear policies from the major central banks and mounting growth risks, demand for gold remains robust, making it an attractive asset for long-term holding.
Trump Tariffs to Deteriorate Sentiment
President Trump had given temporary relief from imposing tariffs on major trading partners. This was a 90-day pause, ending on July 9. Meanwhile, the US trade negotiations with the EU, China, Japan, and Canada have not yielded any meaningful results. The probability of imposing aggressive tariffs may trigger concerns about a global growth slowdown. Ultimately, the safe-haven flows to gold may help the bulls further.
US Economic Data Sends Weakening Signals
The recently published data from the US gave mixed signals. The US ADP data for May was highly harmful, while the NFP figures were better than expected.
However, the NFP figures show a consistent decline. The CPI and PPI data for May also showed a decrease. Cooling inflation and favorable labor market data pressured the US dollar, boosting support for precious metal prices.
Market participants continue to closely monitor the economic calendar for further clues on interest rate direction and market sentiment.
Geopolitical Tensions Fueling Safe-Haven Demand
Gold, being a safe-haven asset, benefits from global turmoil. The Ukraine-Russia war, which started in 2022, continues to deteriorate risk sentiment. On the other hand, Israel’s aggression in the region and expanding strikes in Iran created havoc. Subsequently, the US B-2 stealth bombers joined the Israeli forces and bombarded three nuclear sites of Iran. However, US President Trump later announced a ceasefire, which helped cool the Middle East chaos.
The gold prices that were soaring across the London and New York sessions were affected by risk-on flows. However, the price found a “buy gold” signal just under $3,300 as the USD suffered more from the Middle East truce. Both silver and gold benefited from the situation.
Against this backdrop, gold’s downside may be limited as central banks are gradually increasing their gold reserves. Only in the first quarter of 2025, central banks purchased 244 tons of gold, and the number could surpass 1,000 tons by the end of the year.
Technical Setup and Gold Price Forecast
The weekly chart for gold shows a strong bullish trend starting from October 2023, triggered by the Israel-Hamas attacks. Since then, the price has remained well above the 20-week SMA. Few corrective downside waves occurred, but they were well-supported by the dynamic 20-week SMA. The weekly RSI indicates that the price is slightly below its overbought zone, with a mild downward trend.
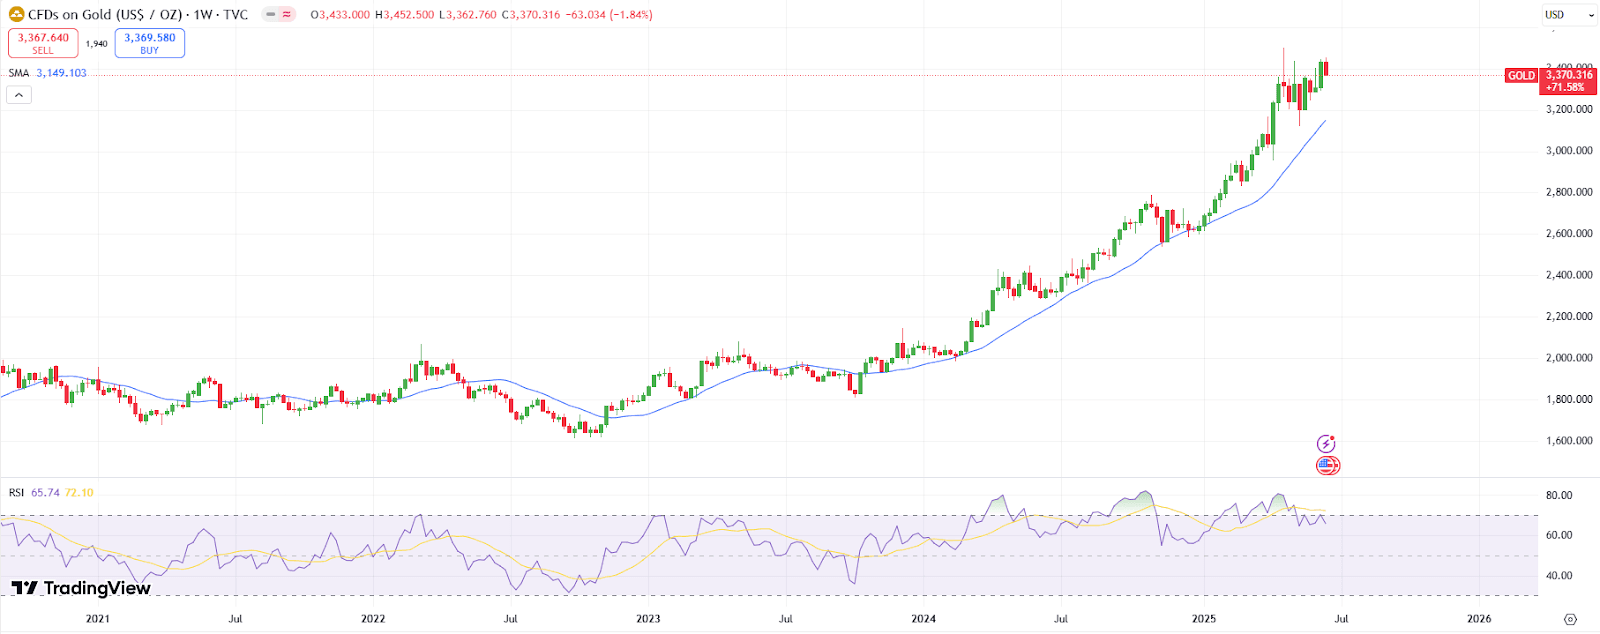
Gold Weekly Chart
The daily chart shows a similar scenario. The price is guarded by the 20-day SMA, with no apparent signs of bearish reversal. The daily RSI is around a neutral level. The pullbacks present strategic gold buying opportunities.
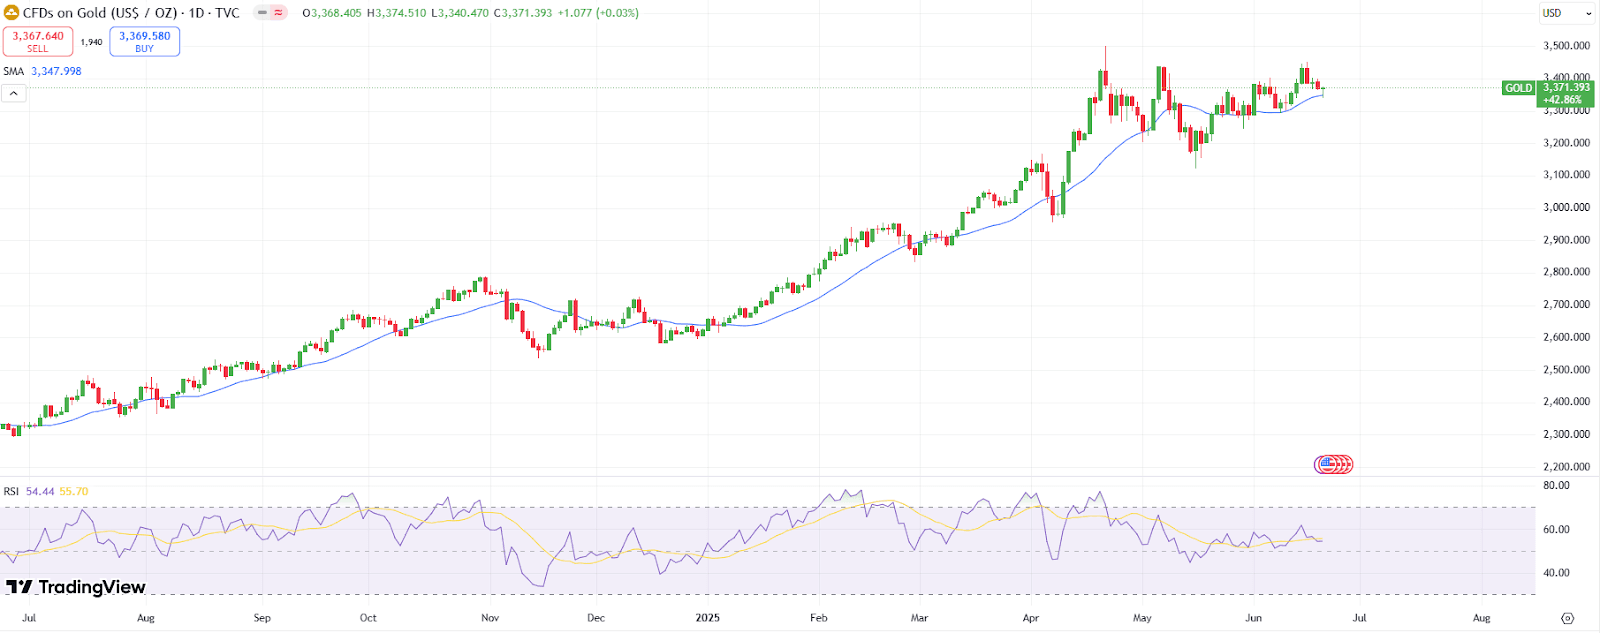
Gold Daily Chart
The metal has gained 28% year-to-date, with a significant resistance at $3,450 ahead of all-time highs around $5,500 per ounce. The downside remains supported by the key level of $5,300. The Q3 2025 target for gold lies at $5,550, ahead of the year-end target of $5,600.
Stay updated on key macro events that move gold prices through our live economic calendar.
Find Your Perfect Broker: Explore Our List Now!
Choose the best with our expert-selected options


Find Your Perfect Broker: Explore Our List Now!
Choose the best with our expert-selected options
Discover top binary options brokers tailored to your region. Browse our curated lists by country: