Updated:November 13, 2026

7 min

How the Xmaster Formula indicator works on MT4 charts
Xmaster Formula is a family of custom trend indicators commonly found in MetaTrader 4 download catalogs. Many versions color a smoothed line green or red and place an arrow when the direction changes. The problem is that files called Xmaster, XHMaster and Xhmaster Formula are not always the same program. A setting or performance claim from one file may tell you nothing about another. Before trusting an arrow, identify the exact build and test how it behaves on closed candles.

Vishenko Dmitry
Author

Updated November 13, 2026
What the Xmaster Formula indicator shows on MT4 charts
Most widely circulated versions try to smooth price movement and highlight changes in direction. A green segment can mean that the calculated trend is rising, while red denotes a falling reading. Some add yellow arrows or alerts at the transition. The calculation is a trend filter, not a forecast of the next candle's closing price. It will often react after part of a move has already occurred.
A screenshot with alternating arrows can look impressive because the best turns stand out. In real time, a trend filter has to choose between quick response and noise. More smoothing normally reduces choppiness but adds lag. Less smoothing may generate earlier signals at the cost of more false flips. The correct balance depends on the market and timeframe.
Xhmaster Formula and Xmaster: spelling and versions
"Xhmaster Formula indicator" is frequently used as a spelling variant in search results. It does not establish a single original author or an official upgrade path. Files can be distributed as MQ4 source code, compiled EX4 packages or versions rewritten for MT5. TradingView community scripts bearing a similar name may use different calculations.
Check the version before reading a review
Open the indicator's Properties and inspect the file name, version information and available inputs. If the author publishes source code, compare it with the description. A paid variant with extra alerts may behave differently from a free version whose signal line is based on a smoothed average. Never assume that historical backtests from a different build apply to yours.
Installing Xmaster Formula in MetaTrader 4
Download the file from a source you can evaluate. On MT4 desktop, select File, Open Data Folder, then MQL4 and Indicators. Copy the trusted indicator file into that folder. Return to Navigator and refresh, or restart the terminal. Find the indicator under Custom, drag it onto a chart and inspect the input tab before clicking OK.
A MetaTrader 5 file belongs in MQL5/Indicators and needs the correct MQ5 or EX5 format. An EX4 file will not become an MT5 indicator simply because you rename its extension. If a seller tells you to install an unknown DLL, disable antivirus software or give them remote access to finish setup, stop the process.
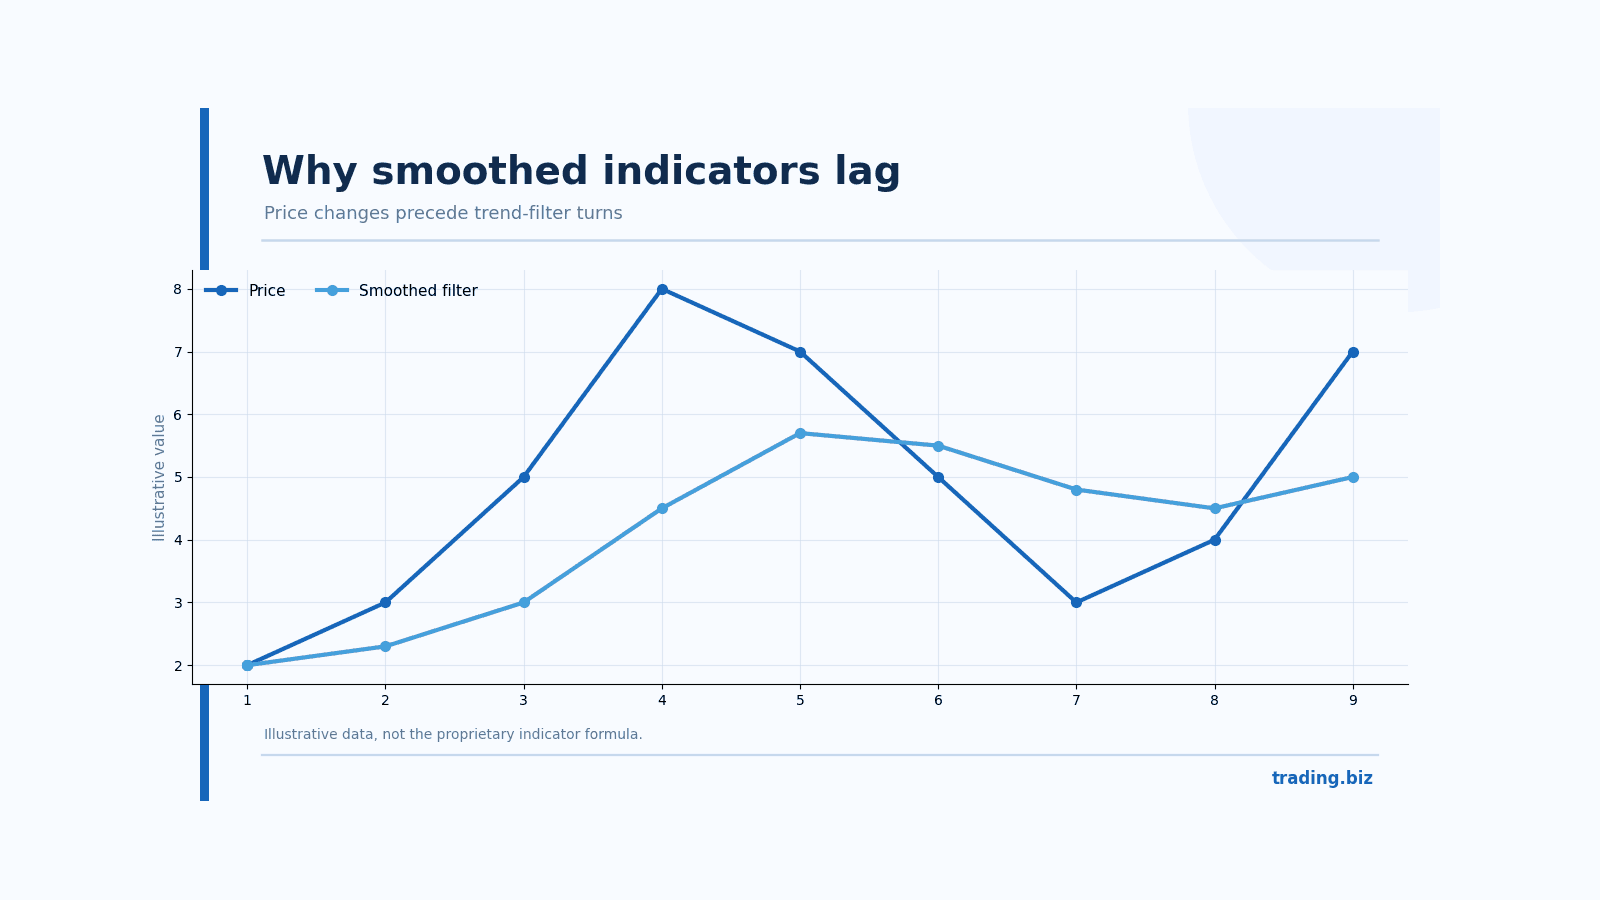
Figure 1. Trend smoothing reacts after part of a price move has developed.
Recommended Xmaster Formula settings and timeframes
There is no universal "best" setting because indicators with the same name use different inputs. A published MT4 implementation discussed in 2026 uses smoothed averages, with a base period of 40 and additional internal smoothing. Other builds let the user modify period lengths. Record the exact parameter values and timeframe before comparing results. Do not repeat a screenshot's settings without checking whether the file uses the same formula.
Testing on an H1 chart
Start with an hourly chart on a liquid pair and use the indicator as a visual trend marker. Record every color change only after the candle closes. For each signal, note how far price has already moved, the next practical entry price and the distance to a defensible stop. Repeat the same exercise on M15 and H4. The timeframe that looks prettiest in hindsight is not automatically the one that survives spread and slippage.
The indicator can be combined with broader market structure, but avoid adding five more lagging averages and calling that confirmation. Signals based on nearly identical inputs are correlated; counting them as independent votes exaggerates the amount of evidence you have.
Limitations: lag, false signals and repainting
A trend indicator is most likely to struggle in a range. Price rises enough to turn the line green, then reverses before a meaningful trend develops. A new red signal appears after the bounce. Over several choppy sessions the sequence can generate many small losses. This is normal for a smoothing method, not a software bug.
Repainting is a separate issue. A signal on the still-forming candle can vanish by the close without fraud or coding error. More serious repainting changes historical closed-bar signals after a refresh. Because the Xmaster name covers multiple versions, "non-repaint" claims should be tested on the exact file in use rather than accepted from marketing text.
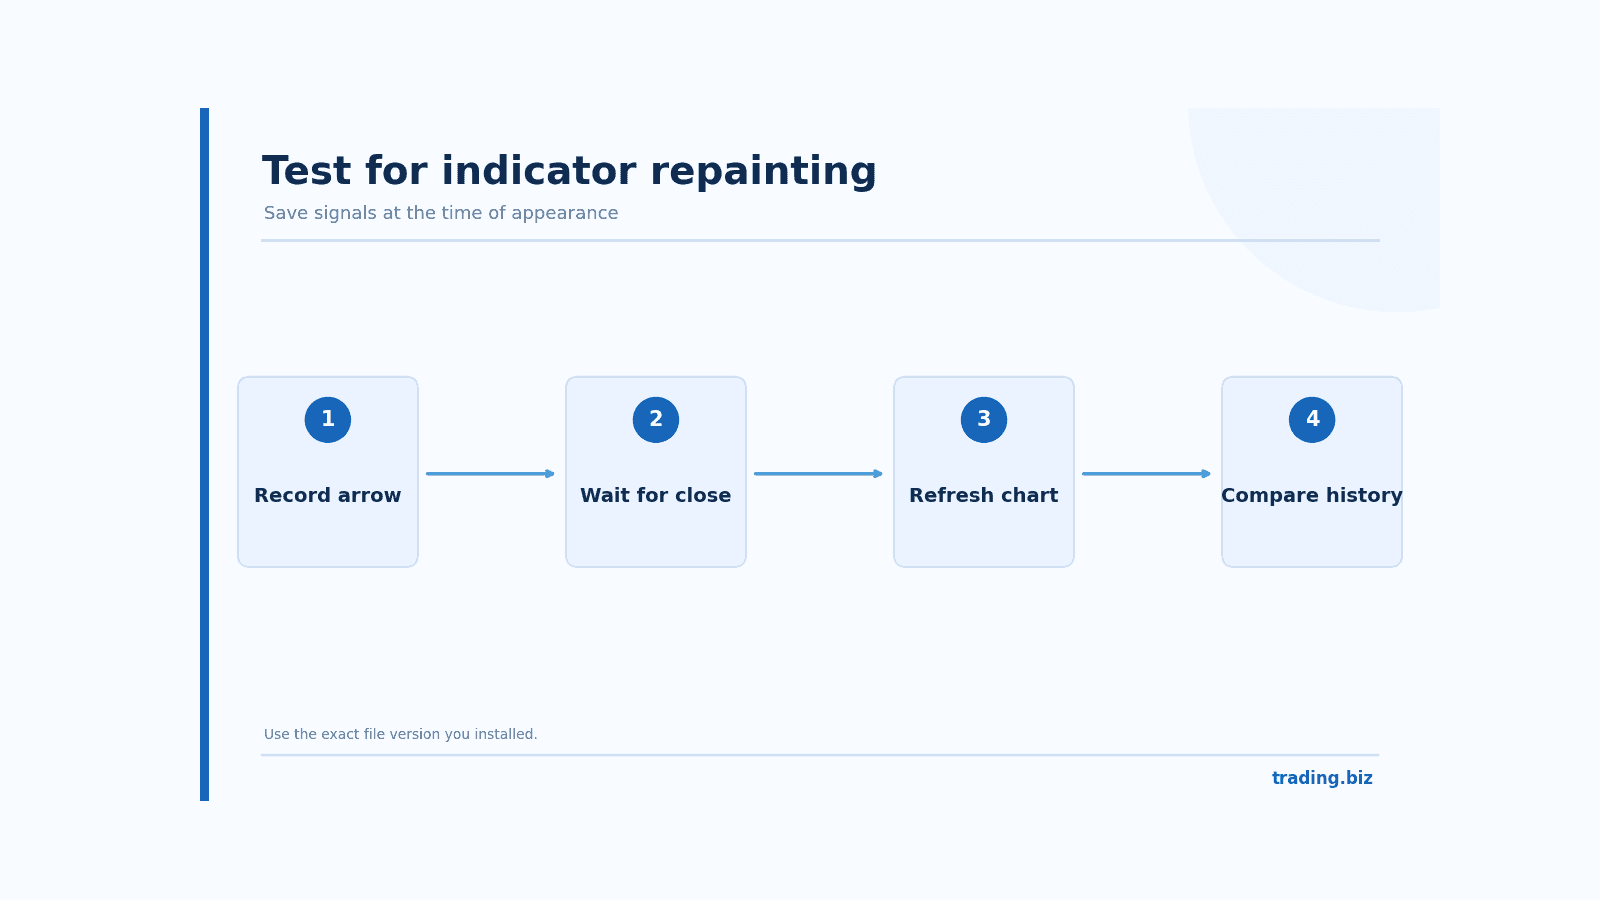
Figure 2. A repeatable check for signals that change after a chart refresh.
A practical repaint test
Run the indicator during a live demo or slow historical replay. Record the time each arrow first appears. After several sessions, reopen the chart and compare those saved signals with the current history. If an old arrow has moved or disappeared, investigate the indicator's recalculation method. Keep screenshots of the entry-time view, not just the final chart after it has repainted itself.
Where to download Xmaster Formula safely
Prefer a publisher page with visible version notes, independent comments and source code when possible. The MQL5 Market and community code libraries can provide more context than an anonymous file mirror, though no marketplace listing guarantees performance. Scan downloads and never provide an indicator seller with your trading password. Password access is unnecessary for a custom chart overlay.
A download page promising a 90% success rate or guaranteed signals is a reason to leave, not a reason to rush. Test the version on demo with a written rule set. Track spreads, commissions and losing runs. If you cannot reproduce the advertised results, the claim has no value for your trading.
A backtest that does not reward hindsight
Choose one version of Xmaster, one instrument and a defined period before looking at the results. Save the file hash or at least the version number so you know what was tested. Write the exact rule for when an arrow becomes actionable, such as after the candle closes. Include trades that would have occurred during a range, even if the signals are unattractive in hindsight.
Calculate average win, average loss, win rate and maximum drawdown after costs. A high win rate can hide a poor strategy if occasional losses are much larger than ordinary winners. Split the history into a period used to choose parameters and a later period left untouched until the rules are fixed. If performance collapses outside the first sample, the attractive chart was probably overfit.
Do one final demo run on the latest version of the file. Watch for alerts that arrive late, arrows that disappear and sessions with thin liquidity. A method that cannot be executed at the displayed historical prices is not usable just because the screenshot looks convincing.
Interpreting the result of a trend-following test
Trend indicators commonly win during persistent moves and lose repeatedly during sideways ranges. A result of forty winning trades and sixty losing trades is not automatically a failure. If average winners are considerably larger, expectancy can still be positive after costs. Equally, a seventy-percent win rate may conceal occasional outsized losses. Review average win and loss in pips, equity drawdown and the sequence of losing signals.
Do not mistake a backtest profit factor for certainty. The indicator may have been tuned to a specific period and the broker's live spread may be wider than the historical assumption. The purpose of testing is to learn which conditions the tool handles poorly, not to manufacture one winning parameter set.
FAQ about Xmaster Formula
Is Xmaster Formula a built-in MT4 indicator?
No. It is a custom indicator distributed by third parties. You need to install a trusted file manually on the desktop terminal.
Is Xhmaster Formula the same as Xmaster?
The names are often used interchangeably, but versions differ. Check code, file format and input values before comparing reviews or settings.
Does Xmaster Formula repaint?
It depends on the build and whether the candle is closed. Test your exact version by recording signals as they appear and checking them again after a chart refresh.
Can I use the MT4 version on MetaTrader 5?
Not directly. MT5 needs an appropriate MQ5 or EX5 implementation. Renaming the extension will not make MT4 code compatible.
What timeframe is best for Xmaster Formula?
There is no verified universal setting. Compare a few liquid instruments and timeframes on demo while including realistic execution costs and all losing signals.
Official reference: MetaTrader community code library
Find Your Perfect Broker: Explore Our List Now!
Choose the best with our expert-selected options
Find Your Perfect Broker: Explore Our List Now!
Choose the best with our expert-selected options
Discover top binary options brokers tailored to your region. Browse our curated lists by country: