Updated:November 11, 2026

6 min

The Symmetrical Triangle Pattern
A symmetrical triangle forms when price compresses between a falling resistance line and a rising support line. It is usually a continuation pattern, and it has clear rules for entry, targets and invalidation. Updated September 2026.

Pejman Zwin
Author

Updated October 23, 2026
A symmetrical triangle forms when price compresses between a falling resistance line and a rising support line. It is usually a continuation pattern, and it has clear rules for entry, targets and invalidation. Updated September 2026.
Under the Christmas tree
The pattern in brief
-
Structure: converging trend lines, resistance falling and support rising
-
Type: usually continuation, occasionally reversal
-
Minimum pivots: four, two tops and two bottoms
-
Apex: where the two lines would intersect if extended
-
Volume: declines during formation, increases on the breakout
-
Entry: after the breakout candle closes beyond a trend line
-
Half rule: the pattern should resolve before price reaches the apex
-
Markets: works in both one-way and two-way markets
How it forms
When a trend loses momentum, price enters a stabilisation phase. Buyers step in on declines and sellers step in on advances, producing progressively lower highs and higher lows.
Drawing a line across the highs and another across the lows gives two converging lines forming a triangle.
At least four significant pivots are required: two tops and two bottoms. Without them the lines are drawn through insufficient data and the pattern is not established.
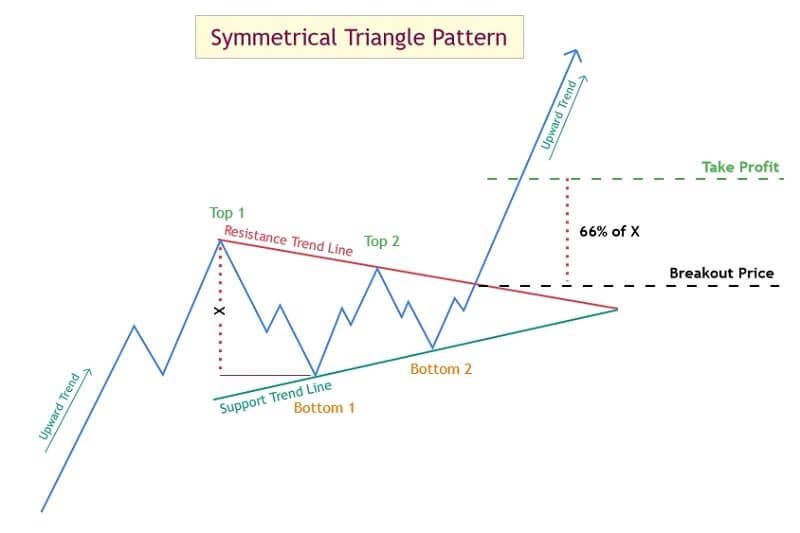
In an uptrend
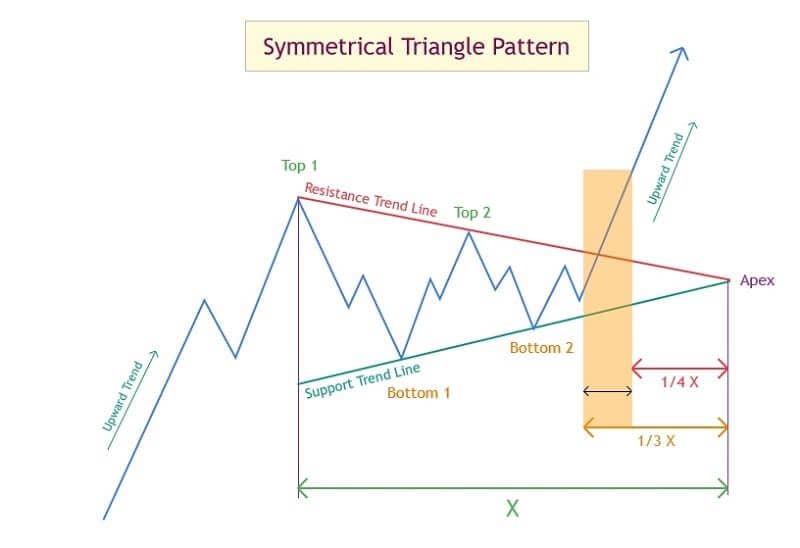
After an advance, price forms a top and a bottom, then a lower top and a higher bottom. The apex should sit at a price between the highest top and the lowest bottom of the formation.
Enter long when the resistance line breaks, after the breakout candle closes above it. The stop goes below the breakout candle, or below the last swing low for a wider version.
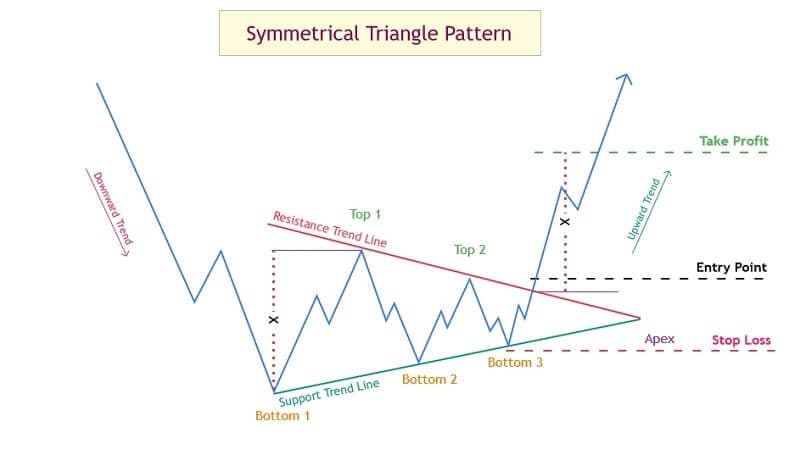
Two methods exist for setting the target.
-
Method one: measure the distance between the first top and the first bottom, and project it from the breakout point
-
Method two: draw a line from the first top parallel to the support trend line, and use where price meets it as the target
The second method effectively treats the continuation as a price channel, where the parallel line acts as resistance. Since symmetrical triangles are continuation patterns, holding part of the position beyond the first target, toward twice that distance or the next resistance zone, is a reasonable approach with a trailing stop.
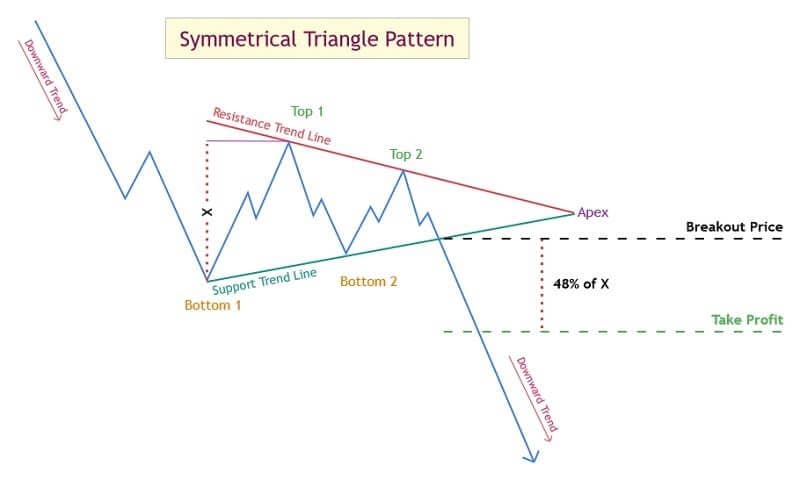
In a downtrend
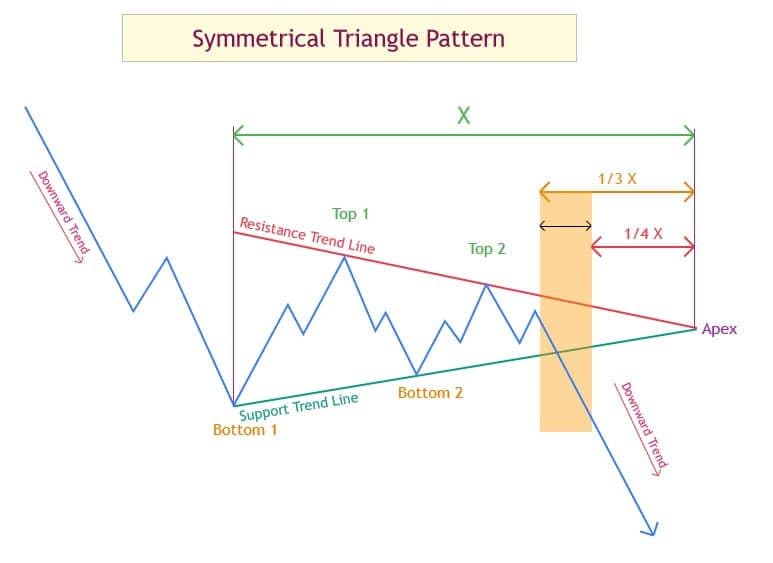
The structure mirrors: after a decline, price forms lower tops and higher bottoms within converging lines, with support rising and resistance falling.
Enter short when the support line breaks, after the breakout candle closes below it, with the stop above the breakout candle.
Targets use the same two methods, measured from the first bottom to the first top and projected downward, or via a parallel line drawn from the first bottom.
On daily charts in equity markets, waiting up to three days for confirmation is a reasonable filter: price should remain beyond the trend line during that period rather than closing back inside.
When it breaks the other way
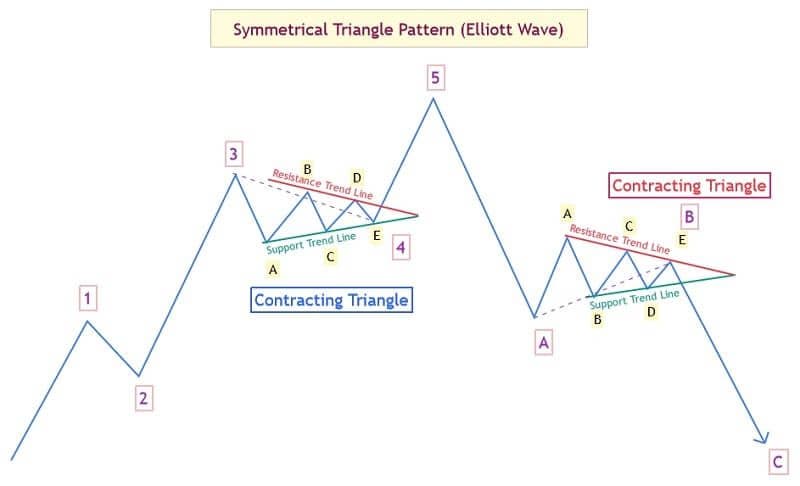
A symmetrical triangle in an uptrend sometimes breaks downward, and one in a downtrend sometimes breaks upward. In that case it is acting as a reversal pattern rather than a continuation.
This is why the pattern should not be traded in anticipation. The converging lines tell you a resolution is coming, not which direction it takes. Enter on the break that actually occurs, in whichever direction it occurs, with the stop on the other side of the breakout candle.
The half of triangle rule
Extend both lines to their intersection, the apex. The pattern should resolve well before price reaches that point, conventionally within the first half to two thirds of the distance.
A triangle that runs to the apex has compressed to nothing: there is no range left to break out of, and price typically drifts through the convergence without a decisive move. Beyond that point, treat the pattern as invalidated rather than pending.
Volume
Volume declines throughout the formation of the triangle, which is characteristic of all consolidation patterns: participation falls while the market waits.
On the breakout, volume should increase. A break on flat or declining volume lacks participation behind it and is considerably more likely to fail.
Volume carries more weight for upward breakouts than downward ones, because rising prices require active buying while falling prices can occur simply through an absence of buyers.
Checklist
-
Count at least four significant pivots before drawing the lines
-
Confirm volume is declining during formation
-
Wait for the breakout candle to close beyond the line, in either direction
-
Check the pattern resolves before the apex, using the half rule
-
Confirm volume increases on the breakout, especially for upward breaks
-
Set the target by measured move or parallel line, and consider holding part of the position with a trailing stop
See related trading guides and compare charting platforms in our forex brokers section.
Symmetrical triangle: frequently asked questions
What is a symmetrical triangle?
A consolidation pattern formed by converging trend lines, with falling resistance and rising support. It is usually a continuation pattern.
Research is ascinating
Symmetrical Triangle Time Failing

Market Volume and the Symmetrical Triangle
Symmetrical Triangle Pattern as a Reversal Pattern in Downtrends
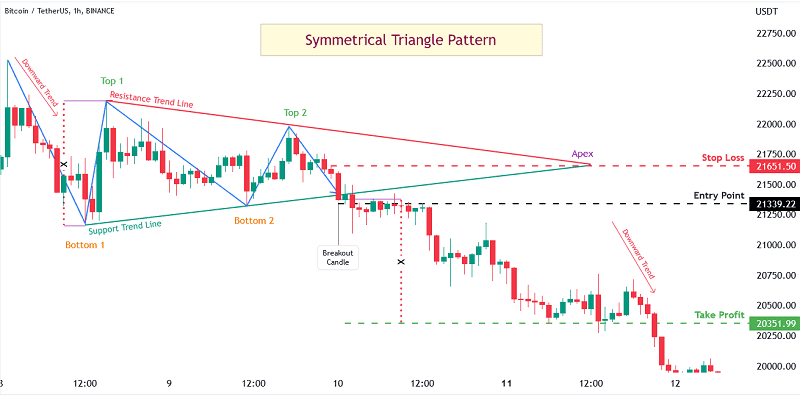
BTC/USDT in the 1-hour time frame
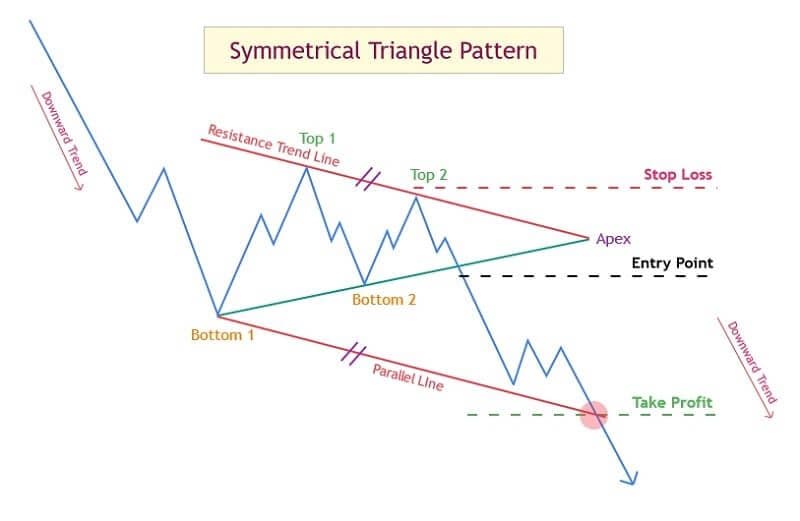
Withdraw the other part at the second target
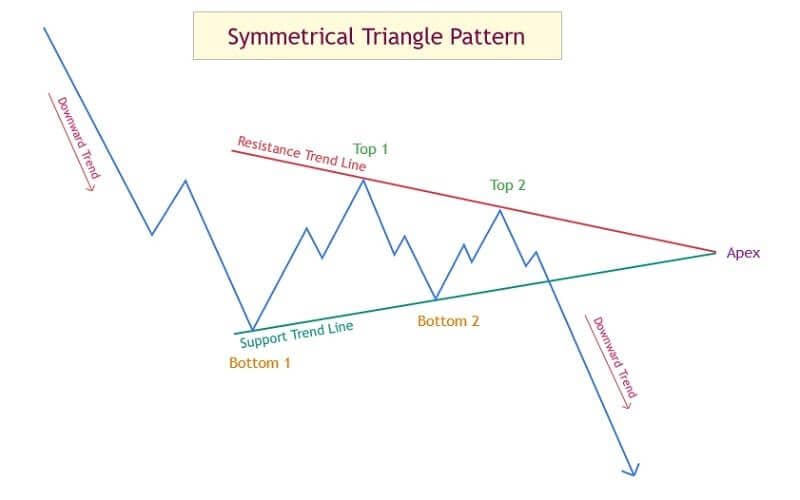
Symmetrical Triangle

Symmetrical Triangle Pattern in Downward Trends
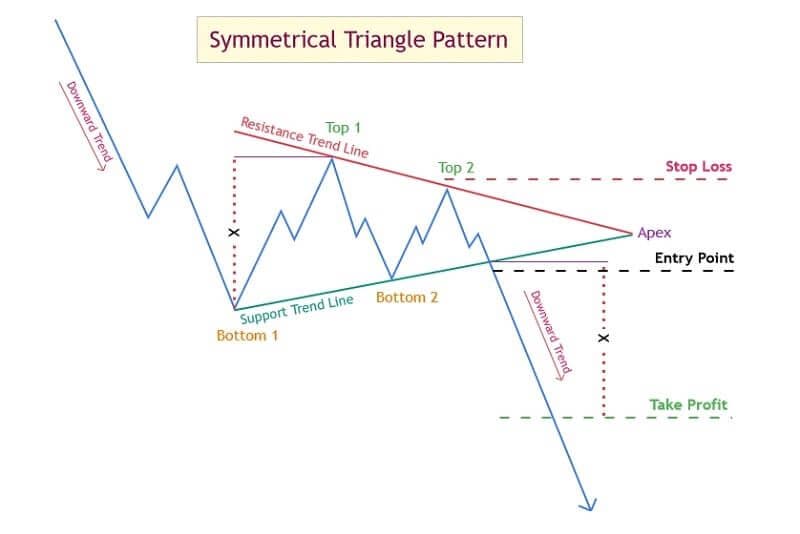
Symmetrical Triangle Pattern as a Reversal Pattern in Upward Trends
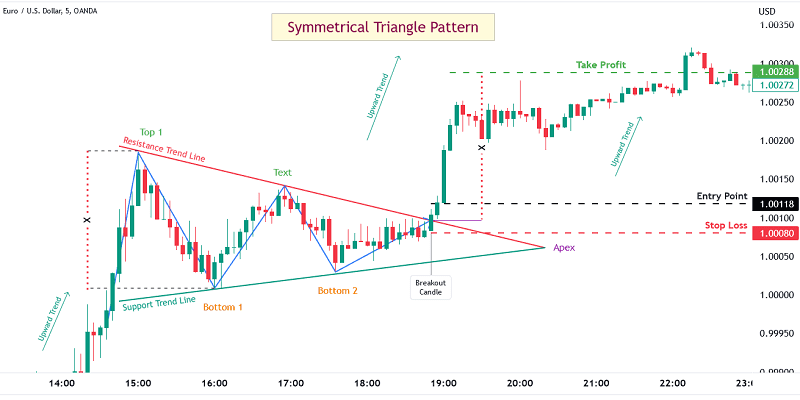
EUR/USD In the 5-minute time frame
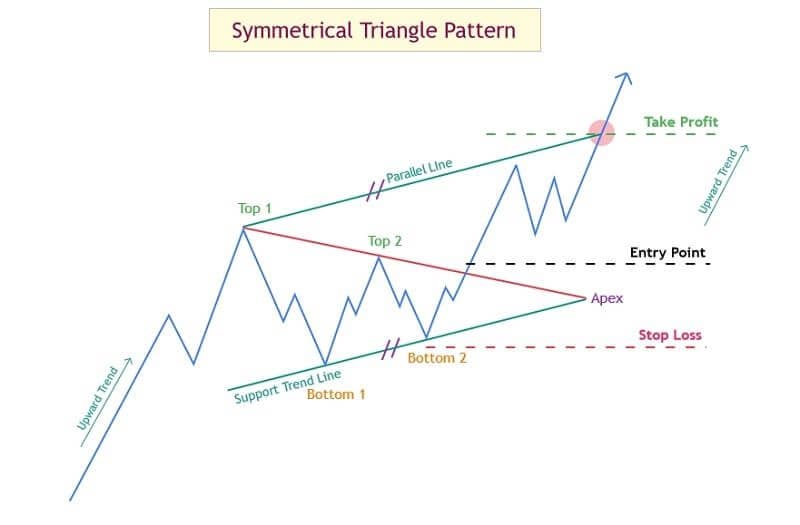
Upward channel
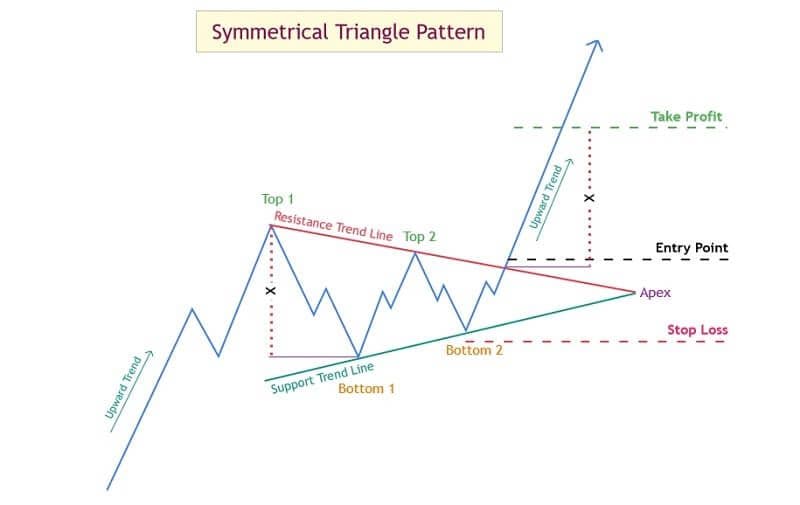
Trade on the Symmetrical Triangle in Upward Trends
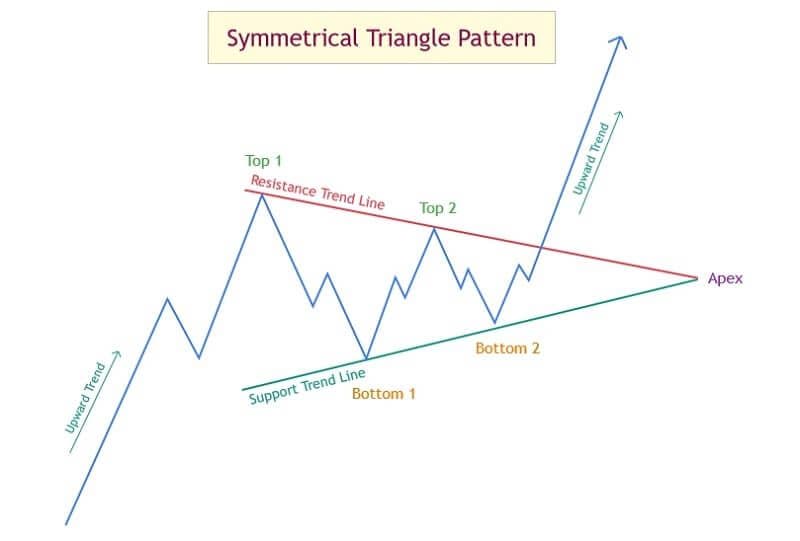
Symmetrical Triangle Pattern

Symmetrical Triangle Pattern
How many pivots are needed?
At least four: two tops and two bottoms. Fewer means the lines are drawn through insufficient data.
Which direction will it break?
The pattern does not tell you. Enter on the break that occurs rather than positioning in advance, with the stop on the other side of the breakout candle.
What is the half of triangle rule?
The pattern should resolve within the first half to two thirds of the distance to the apex. Beyond that, treat it as invalidated.
Downward trend
Bulkowski's Research
How do I set the target?
Either measure the distance between the first top and first bottom and project it from the breakout, or use a parallel line drawn from the first pivot.
Elliott Theory
What should volume do?
Decline during formation and increase on the breakout. A break on flat volume lacks participation and is more likely to fail.
Find Your Perfect Broker: Explore Our List Now!
Choose the best with our expert-selected options

Find Your Perfect Broker: Explore Our List Now!
Choose the best with our expert-selected options
Discover top binary options brokers tailored to your region. Browse our curated lists by country: