
6 min

2305
Market Trends for Trading: Top 5 Tools and Techniques
Trading and capitalizing on market trends requires using the right tools. Read our post for trending ones right for trading in 2026!

Author

Trading and capitalizing on market trends requires using the right tools. To find their profitable edge, successful traders leverage charts, position size and profit calculators, earnings and economic calendars, market overviews, and heat maps to see what’s on the move. All of these tools, and more, are available for free here on Trading.biz. You too can use them to analyze markets and improve your trading performance.
1. Technical Analysis Platforms
A key tool for researching market trends is technical analysis. Technical analysis is the study of how prices move, and traders use it to see what is moving, in which direction, and how strongly.
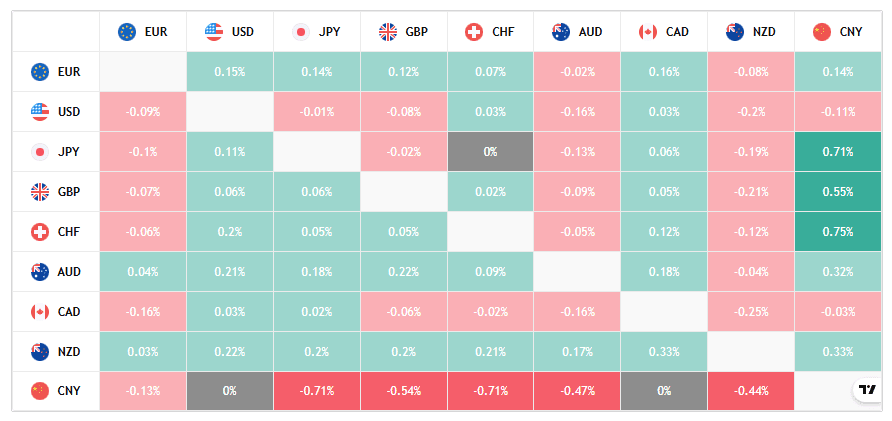
For example, the Currency Heat Map shows which currencies are up/down and by how much. This is a quick way to see where the action is.
The percentages show the currency on the left compared to the currency along the top row.
For example, the JPY is up 0.71% versus CNY, or JPY/CNY is up 0.71%. On this particular day, that was one of the bigger moving currency pairs.
The Technical Summary Box is another market analysis tool. It shows how major stock indices, bonds, and forex pairs are performing. It provides a snapshot or overview of the bullish or bearish bias of the day. It is a condensed market trend research report.
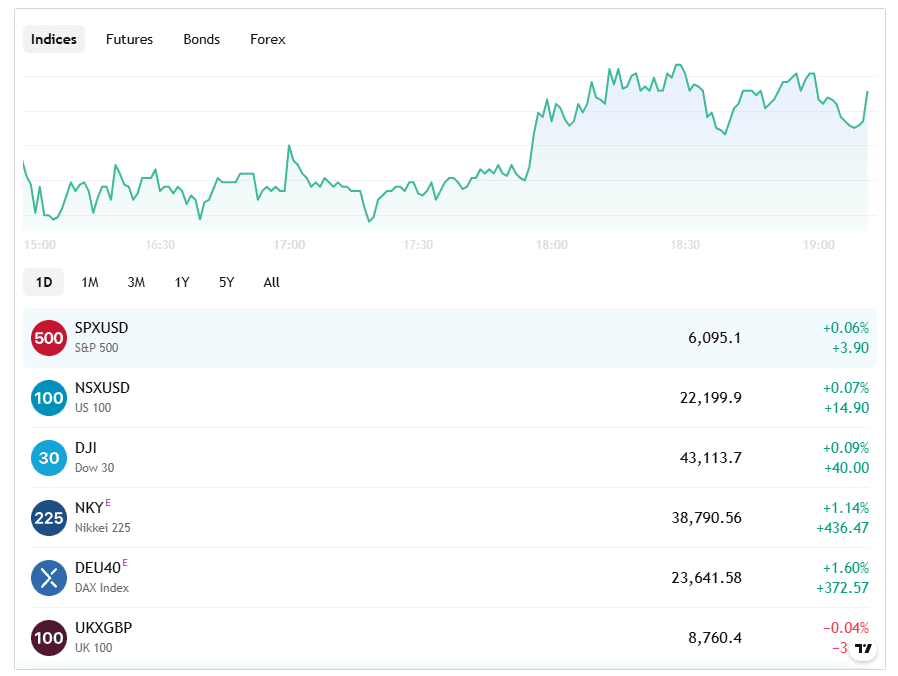
Traders can quickly see the rising trend over the last day and that all the major US indices are higher, as well as other indices. The UK is down only marginally. On a day like this, the market tool indicates favoring long trades.
2. Paper Trading Simulators
Simulators are market analysis programs that show how profitable a strategy is and how well a trader is doing.
The Profitability Calculator on Trading.biz allows traders to calculate profits and losses on trades, including forex rollover and trading commissions, without putting real capital at risk.
Here’s how to use it, along with a couple of other free tools to test out trade ideas and start building profitable strategies.
- Utilize our free real-time charts to spot potential trades. Charts are the primary tool for trend analysis.
- Pick an entry price, stop loss price, and target price (or other exit method).
- Then use the position sizing calculator to get the ideal position size for any account size. Use a realistic account size, such as the one you typically trade or will be trading.
- Then, plug the data into the Profitability Calculator to see the total return.
- Keep track of the results and repeat the process over many trades to see overall performance and what could be improved.
3. Candlestick Pattern Analysis
Candlestick patterns are another market and trend analysis tool. Candlestick patterns, chart patterns, and technical indicators can all provide trade signals, telling traders when to enter and exit trades.
There are many different candlestick patterns. A simple one is an “inside day.” That is when one candle is completely inside the prior candle. When price breaks below the low of the inside day, the target is the low of the prior day. If it breaks above the high of the inside day, the target is the high of the prior day.
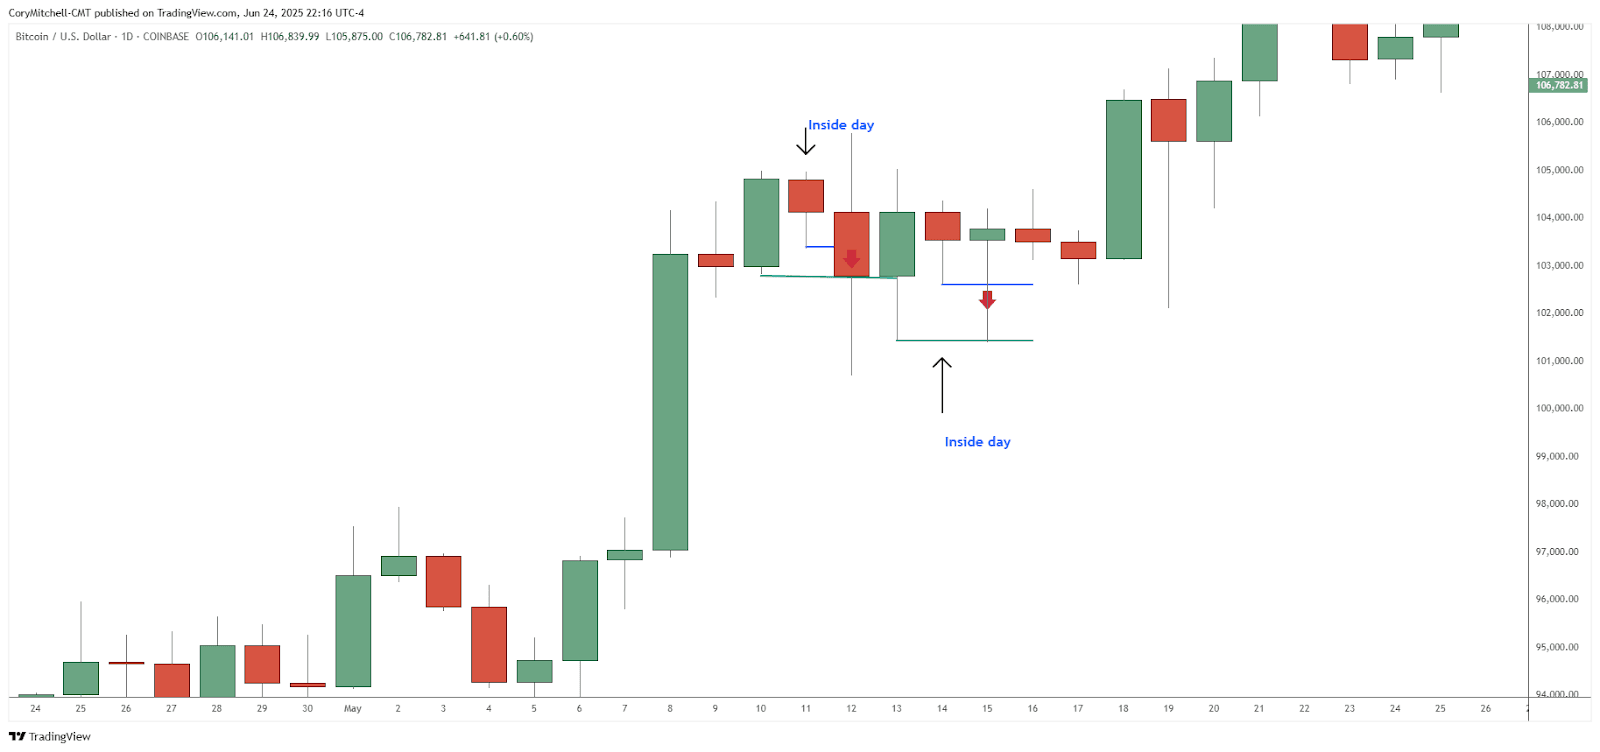
This is just one example of a candlestick pattern. This simple idea can be expanded on to include taking trades on different time frames. It also requires risk management, such as placing a stop loss and controlling position size.
Utilize our free charts (click Tools on the main menu, then Charts, then Online Trading) to find the signals. Use the position sizing calculator and profitability calculator to get in the habit of investing the perfect amount of capital for the account size.
4. Platforms for Active Traders
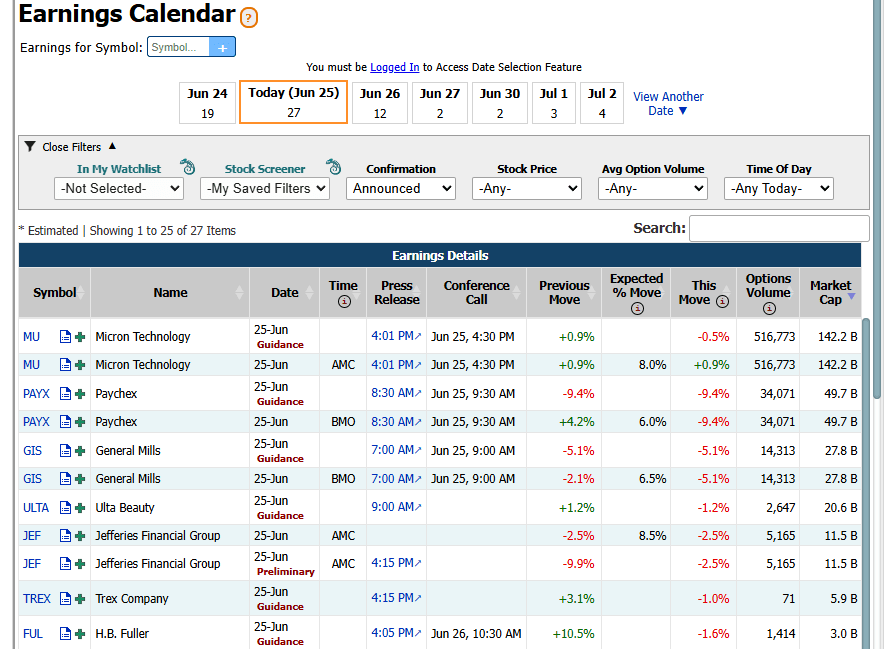
Active traders need tools to analyze market trends in the financial products they trade. The Earnings Calendar tells stock traders when companies are releasing their earnings statements. This is crucial information for both active traders, so they are aware of when these volatile events occur, and for long-term investors to monitor how companies they own are doing.
An earnings release is one of the most volatile events a stock experiences. Prices can rise or fall or dramatically, depending on how the company performed. Earnings are released quarterly.
The Economic Calendar is another platform for active traders to analyze the market. It lists all the scheduled economic data releases from various countries. High-impact news releases can cause large price movements, so short-term traders need to know when these events occur to avoid being unsuspectingly caught in the crossfire of a big move or price gap.
The Heat Map is a key tool for market analysis; forex traders rely on this platform to spot which currency pairs are moving strongly, weakly, or are flat (and thus potentially avoided until they start moving).
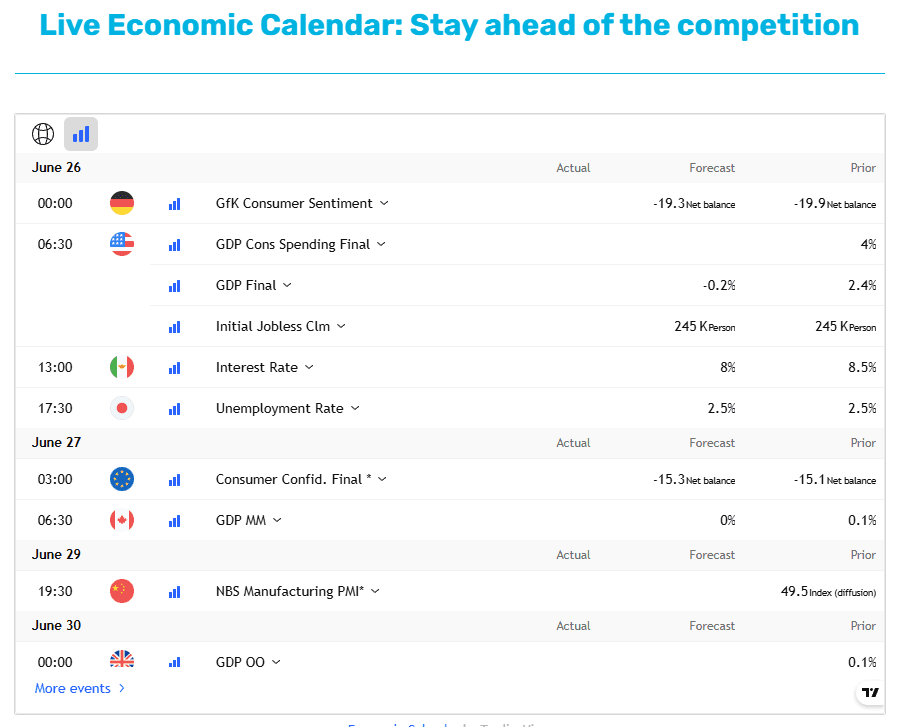
On the main menu, click Tools, then Calendars to stay on top of the latest (or upcoming) earnings and economic releases.
5. Strategy Testing and Development Tools
To succeed, traders test out strategies, refine them, and always look for ways to improve. This includes having accurate data, controlled position sizes, and proper risk management.
The Pip Calculator is for forex traders. It is used to calculate the dollar amount of each pip of movement, called the pip value. It is a required piece of information for getting the correct position size.
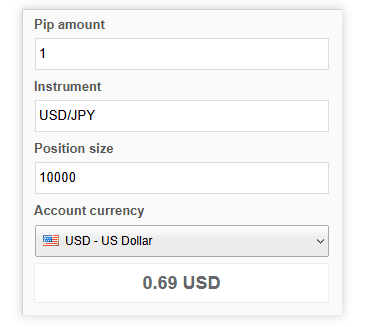
Position sizing is a key component of risk management. A stop loss is set for the trade, and then the position size is calculated based on it. Following these two steps, traders can set the amount of money that could potentially be lost on a trade.
The Trader’s Profitability Calculator tabulates potential profits and losses on trades similar to a simulator. Input the entry price and the price at the time of closure to see the profit or loss, as well as the impact of rollover (for forex trades) and commissions.
Combine these tools to keep risk controlled. Warren Buffett, famed investor, said, “Risk comes from not knowing what you are doing.” Use the tools to practice, refine, and avoid being someone who doesn’t know what they are doing.
Master the Market — Apply These Techniques Today!
Practice technical investing by looking for patterns on our Live Charts (Tools-Charts-Online Trading page) and then simulating trades in the Trader’s Profitability Calculator.
The Economic Calendar is a key market analysis program for long-term investors to stay on top of the health economy and for short-term traders to know when market-moving events are occurring.
For analysis of market trends, our customer research tools are freely available to help stay on top of price movements, data releases, and calculate proper position sizes. All options are available on the main menu by clicking the Tools menu.
Find Your Perfect Broker: Explore Our List Now!
Choose the best with our expert-selected options

Find Your Perfect Broker: Explore Our List Now!
Choose the best with our expert-selected options
Discover top binary options brokers tailored to your region. Browse our curated lists by country: