Updated:November 11, 2026

5 min

How to Read Price Charts
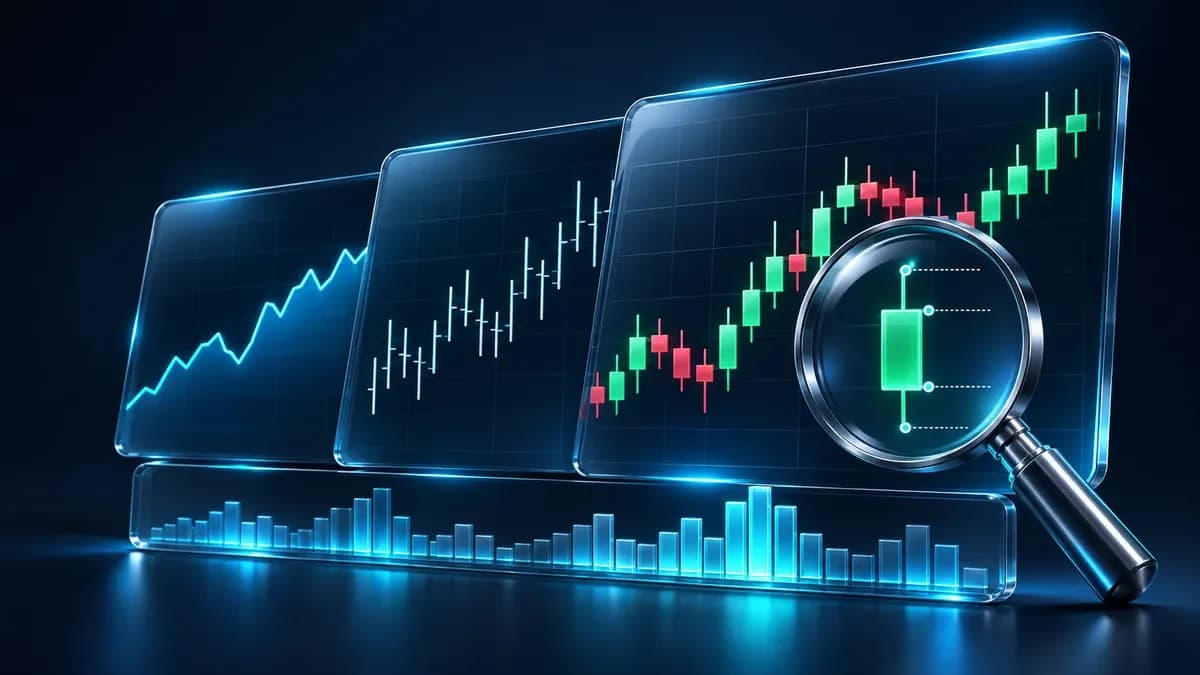
A price chart shows what the market did over time. Three formats dominate, each showing a different amount of detail, and choosing the right one for the question you are asking is most of the skill. Updated September 2026.

Saqib Iqbal
Author
Updated October 23, 2026
A price chart shows what the market did over time. Three formats dominate, each showing a different amount of detail, and choosing the right one for the question you are asking is most of the skill. Updated September 2026.
The three chart types
-
Line chart: connects closing prices only. Simplest to read, shows overall direction, hides everything that happened within each period
-
Bar chart: shows open, high, low and close for each period. More detail, common among traders in Europe and the United States
-
Candlestick chart: the same four values presented visually, with a coloured body and wicks. Easiest to read at a glance, and the basis of pattern analysis
Histograms appear below the price chart rather than replacing it. Volume is the most common, showing how much trading occurred in each period. It supports the main chart rather than standing alone.
Where prices come from
Quotes originate with banks trading currencies continuously. The rates are not hidden: they are distributed through data feeds and reach retail platforms from the same source.
A retail trader is not transacting directly on the interbank market, but the prices displayed derive from it. Charting software is widely available free of charge, both from brokers and from independent providers.
On the claim that broker charts are inadequate for analysis: for most purposes they are fine. Independent charting platforms offer more indicators and drawing tools, which matters for detailed work, but the underlying price data is comparable.
Reading a line chart
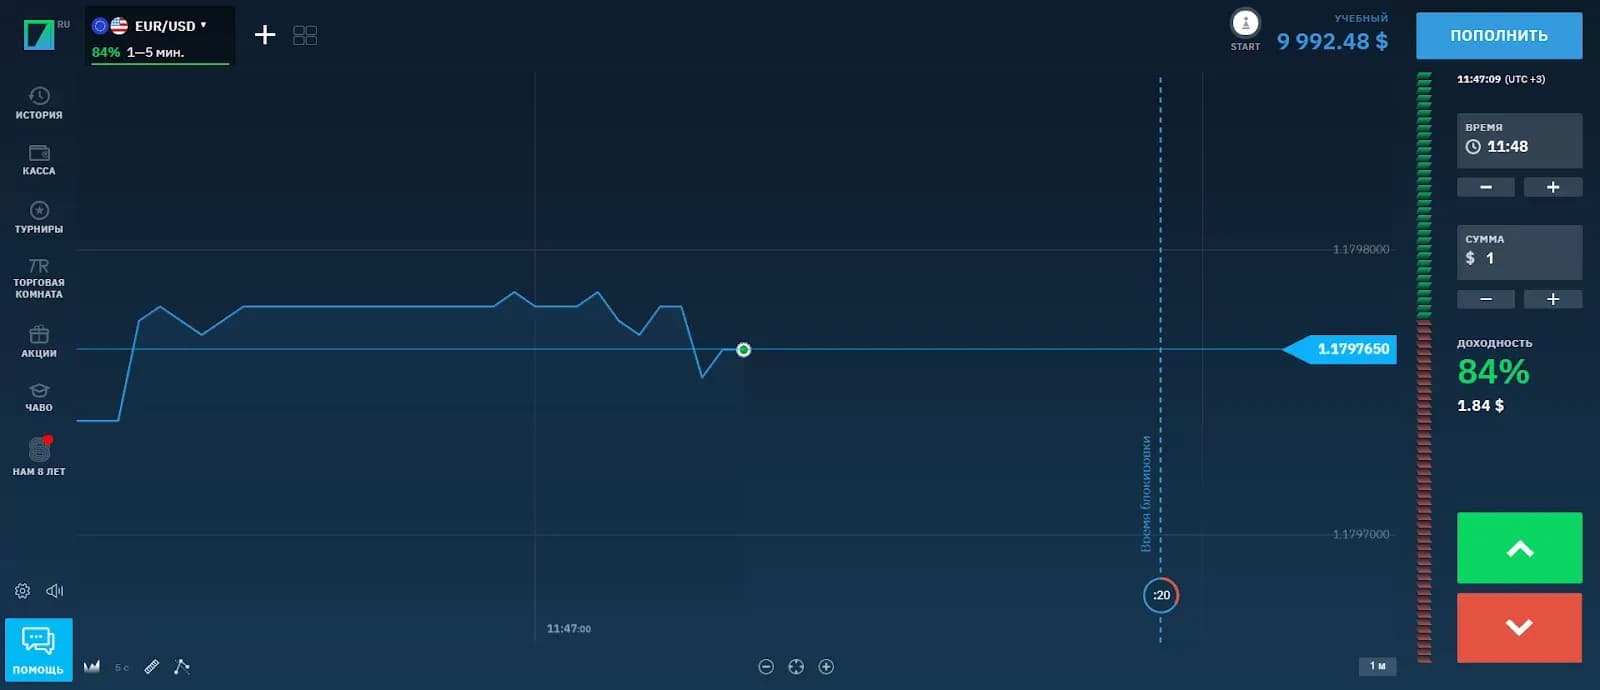
A line chart plots closing prices in sequence. It is the simplest format and the least informative, because everything that happened between closes is discarded.
That simplicity is its purpose. For identifying the overall direction of a market across weeks or months, removing intraday noise makes the trend clearer. It works best on timeframes from one day upward.
Reading a bar chart
Each bar is a vertical line spanning the high and low of the period, with a tick on the left marking the open and a tick on the right marking the close.
learn how to read the graphics of quotations?
This shows the full range rather than just the endpoint, which makes it possible to see how much the price moved within each period and where it ended relative to that range.
Bars are useful around scheduled news, where the range compresses before an announcement and expands sharply afterwards. Watching the ticks tells you where the close sat within the range, which indicates which side held control.
Reading candlesticks
Candlesticks display the same four values as bars, using a filled body between open and close and thin wicks marking the high and low.
-
Open (O): the price at the start of the period
-
Close (C): the price at the end of the period
-
High (H): the highest price reached
-
Low (L): the lowest price reached
Body colour shows direction immediately: one colour when the close is above the open, another when it is below. That visual encoding is why most traders prefer candlesticks, and why nearly all pattern analysis is built on them.
Body size relative to wick length is the information that matters. A long body with short wicks means one side dominated the period. A small body with long wicks means both sides pushed and neither prevailed.
Using two timeframes together
A practical approach is to read two charts of the same instrument at once: a higher timeframe for direction and a lower one for entry timing.
-
Open the platform and select the instrument
-
Choose a higher timeframe, such as daily, to establish the prevailing direction
-
Open a lower timeframe, such as 15 minutes, on the same instrument
-
Take positions on the lower timeframe only in the direction indicated by the higher one
-
Use the lower timeframe for entry and stop placement, not for deciding direction
This ordering is what keeps the two charts from contradicting each other. The higher timeframe answers which way, the lower answers when. Reversing them produces trades that look good on a 15 minute chart and fight the daily trend.
Choosing a timeframe
Shorter timeframes show more detail and more noise. Longer ones show cleaner structure and fewer opportunities.
There is no correct choice in general, only one appropriate to how long you intend to hold a position. A trader closing within the session works on minutes and hours, an investor holding for months works on daily and weekly charts.
Getting started
-
Begin with candlesticks, they carry the most information in the most readable form
-
Learn to read body and wick proportions before learning named patterns
-
Check volume below the price chart, a move without volume behind it means little
-
Use a demo account to practise reading before trading
-
Match your timeframe to your intended holding period, not to how often you want to trade
See related trading guides and compare charting tools across platforms in our forex brokers section.
Reading charts: frequently asked questions
Which chart type should a beginner use?
Candlesticks. They show open, high, low and close visually, and are the basis of nearly all pattern analysis.
What is the difference between a bar and a candlestick?
They show the same four values. Bars use ticks on a vertical line, candlesticks use a coloured body and wicks, which is faster to read.
What do O, H, L and C mean?
Open, high, low and close: the price at the start of the period, the highest and lowest reached, and the price at the end.
What does a long wick indicate?
That price moved to that level and was rejected. Combined with a small body, it indicates indecision between buyers and sellers.
Which timeframe should I use?
One matching your intended holding period. Shorter timeframes show more detail and more noise, longer ones show cleaner structure.
Are broker charts good enough for analysis?
For most purposes yes. Independent platforms offer more indicators and drawing tools, but the underlying price data is comparable.
Find Your Perfect Broker: Explore Our List Now!
Choose the best with our expert-selected options
Find Your Perfect Broker: Explore Our List Now!
Choose the best with our expert-selected options
Discover top binary options brokers tailored to your region. Browse our curated lists by country: