Updated:November 11, 2026

6 min

The Bump and Run Reversal Pattern
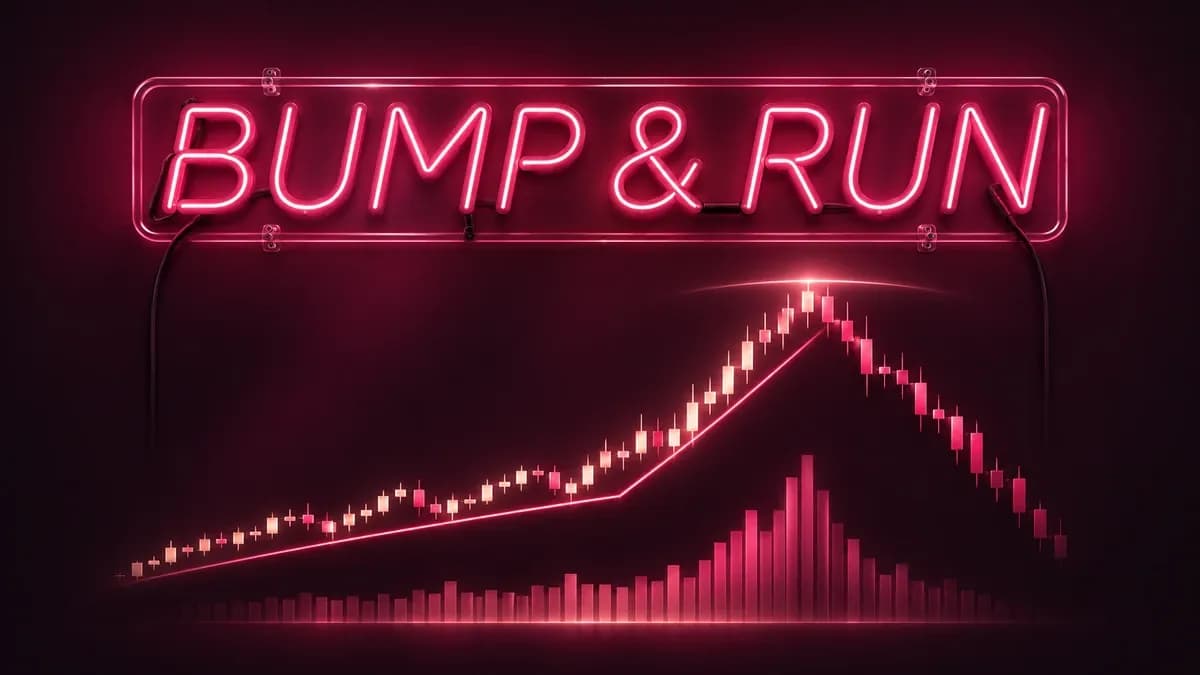
The bump and run reversal, usually shortened to BARR, identifies the point where an accelerating trend runs out of buyers or sellers. It has clear validation rules, which is what separates it from most chart patterns. Updated September 2026.

Pejman Zwin
Author
Updated October 23, 2026
The bump and run reversal, usually shortened to BARR, identifies the point where an accelerating trend runs out of buyers or sellers. It has clear validation rules, which is what separates it from most chart patterns. Updated September 2026.
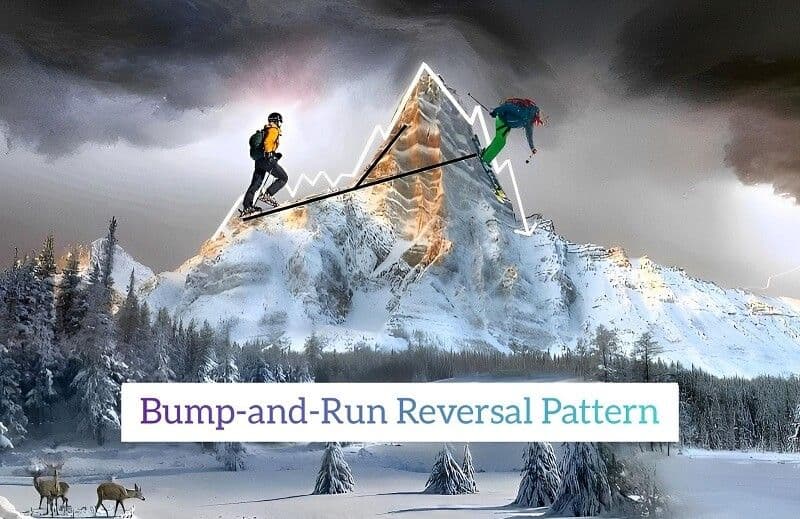
Bump-and-Run Top Pattern
The three phases
-
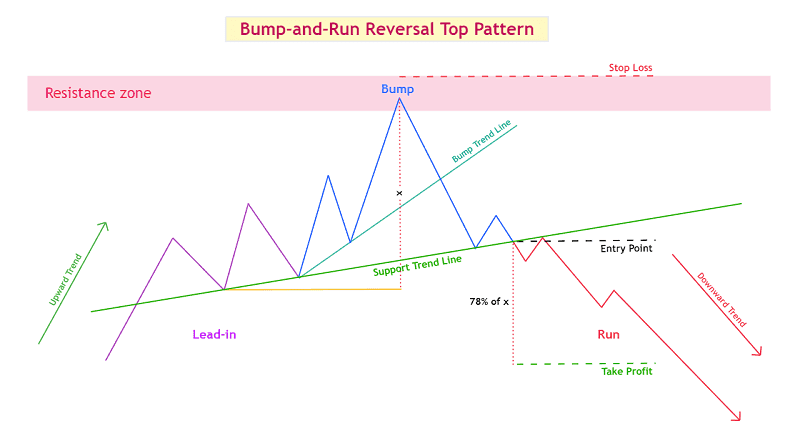
Lead-in: a steady, moderate trend with a shallow slope, typically 30 to 45 degrees
-
Bump: the slope steepens sharply on rising volume as momentum traders join
-
Run: the trend line breaks and price moves in the opposite direction
The pattern exists in two forms. The top version forms after an uptrend and signals a move down, the bottom version forms after a downtrend and signals a move up. The mechanics are identical, mirrored.
The top pattern
The top version forms when a gentle upward trend is replaced by a much steeper one. Price rallies far enough that participants begin questioning the valuation, and buying interest thins out near the peak.
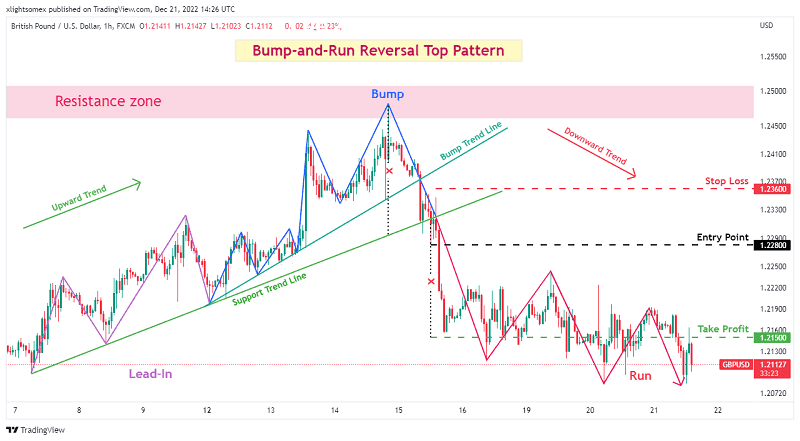
The bump trend line
The distance between the mountain peak

Trade on the Bump-and-Run Top Pattern
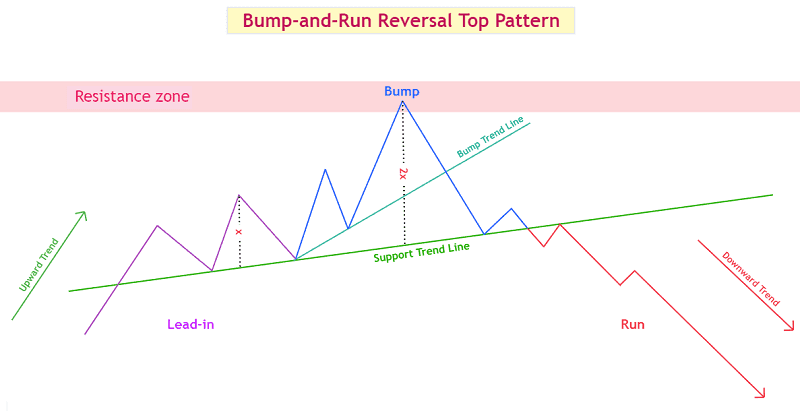
The resistance zone
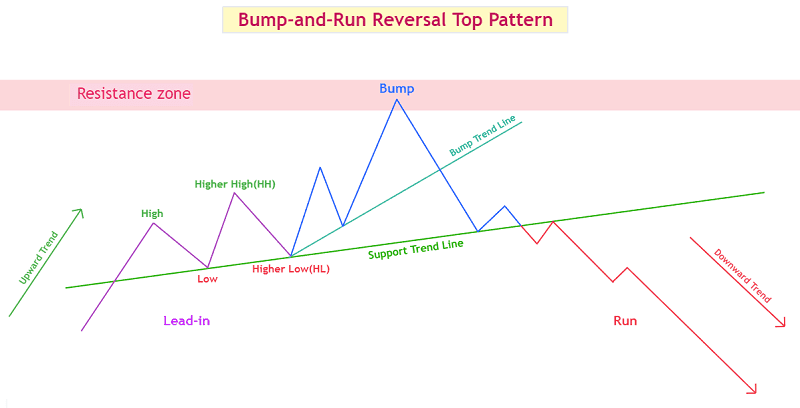
Collecting profits on your way
During the lead-in phase, the trend is steady and the volume is average or even low. The three rising valleys formation often appears here, indicating buyers are still willing to support higher prices.
The bump phase begins when momentum traders enter and volume rises. The slope steepens noticeably and corrections become brief and shallow.
Validating the bump phase
-
Trading volume increases relative to the lead-in
-
Buying pressure visibly strengthens
-
The trend line slope shifts sharply upward
-
Price corrections become brief and mild
-
The bump height is at least twice the lead-in width
-
A clear resistance ceiling rejects price once or more
The height requirement is the most important of these, and it is what makes the pattern testable rather than subjective. If the bump is not at least twice the lead-in width, the formation does not qualify.
One caution on volume: a spike can come from hedge funds adjusting hedges or institutions rebalancing at quarter end, rather than from directional conviction. Volume confirms, it does not prove.
Trading the top pattern
At the end of the bump phase the uptrend loses momentum and a ceiling forms. Price may also break the resistance zone briefly before pivoting back below it, which is a failed breakout rather than a continuation.
The short entry comes when price breaks the support trend line drawn through the lead-in lows. After that break, price frequently retests the broken line from below, which offers a second entry for traders who missed the first.
For the target, measure the vertical distance from the peak to the support line and project it the same distance below the break point.
Three ways to place the stop
-
Conservative: above the pattern high, the widest stop with the lowest risk-to-reward ratio
-
Intermediate: above the most recent swing high within the bump phase
-
Aggressive: above the breakout candle, the tightest stop with the highest risk-to-reward ratio but the highest chance of being hit by noise
These are not ranked by quality. A tighter stop improves the reward ratio and simultaneously increases the frequency of being stopped out on a move that would have worked. Choose based on your win rate, not on the ratio alone.
The bottom pattern
The bottom version mirrors the top. The lead-in is a moderate downtrend containing at least two minor peaks and two minor valleys, and the bump phase accelerates downward on rising volume.
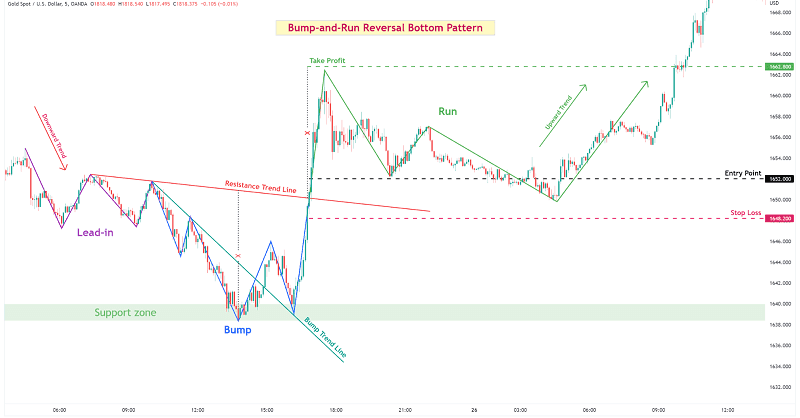
The bump-and-run reversal pattern
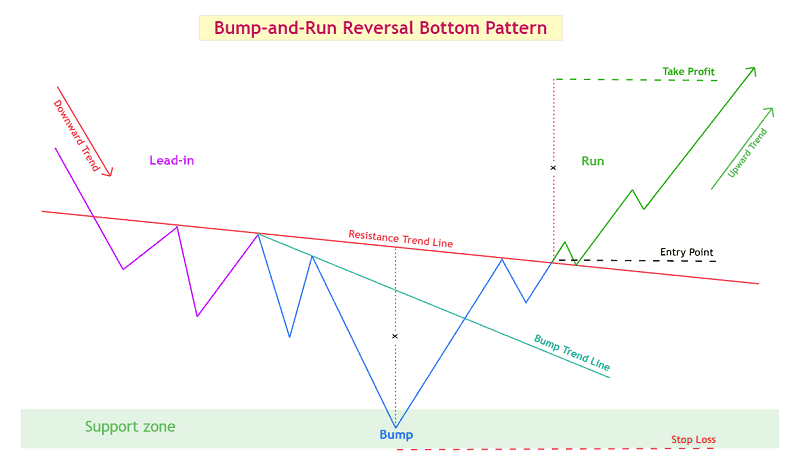
Trade on the Bum and Run Bottom Pattern
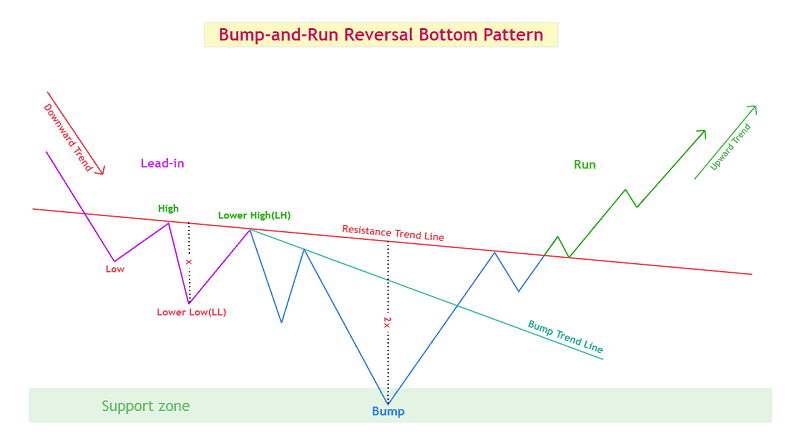
The shape and form

The Bump-and-Run Bottom Pattern Phases
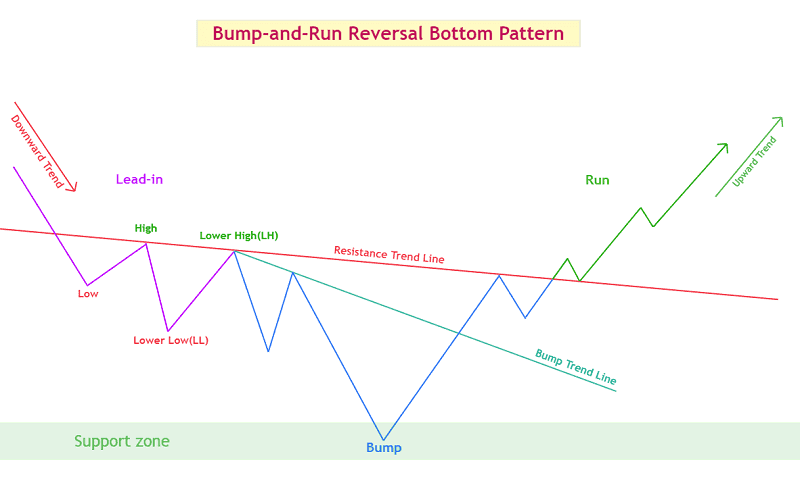
The bump-and-run bottom pattern
Connecting the bump phase peaks gives the bump trend line. When the lowest low reaches the support zone, selling exhausts and the market turns. Price often retests the support zone, forming a double bottom.
The long entry comes on a break of the resistance trend line accompanied by rising volume. The target is measured by adding the distance from the resistance line to the bump low, projected up from the break point. Stop placement follows the same three options, mirrored.
When it is a correction, not a reversal
On larger timeframes the pattern frequently does not reverse the dominant trend. It resolves an overextended move and then the original direction resumes.
This matters for position management. A trade taken on the BARR signal can be correct and profitable while the broader trend remains intact, which means the target should be the measured move, not an assumption that the market has permanently turned. Check the higher timeframe before deciding how long to hold.
The original research
Thomas Bulkowski introduced the pattern in his Encyclopedia of Chart Patterns. It was first named the bump and run formation, abbreviated BARF, and later renamed to bump and run reversal.
Bulkowski established the numerical criteria still used today: a lead-in slope of roughly 30 to 45 degrees, a bump at least twice the lead-in height, and a measured take profit calculated from the pattern dimensions rather than estimated by eye.
Those fixed criteria are the reason this pattern is worth learning. Most chart formations can be seen wherever a trader wants to see them. This one either meets the measurement requirements or it does not.
Practise identifying the pattern on historical charts before trading it. See related trading guides and compare charting platforms in our forex brokers section.
BARR pattern: frequently asked questions
What are the three phases?
Lead-in, a steady trend with a shallow slope. Bump, a sharp acceleration on rising volume. Run, the trend line break and move in the opposite direction.
How do I know the bump is valid?
The bump height must be at least twice the lead-in width, with rising volume, a steeper slope and brief shallow corrections. If the height rule fails, the pattern does not qualify.
Where do I enter?
On the break of the support trend line for the top version, or the resistance trend line for the bottom version, ideally confirmed by rising volume.

Research by scientists on Bump-and-Run Reversal Pattern
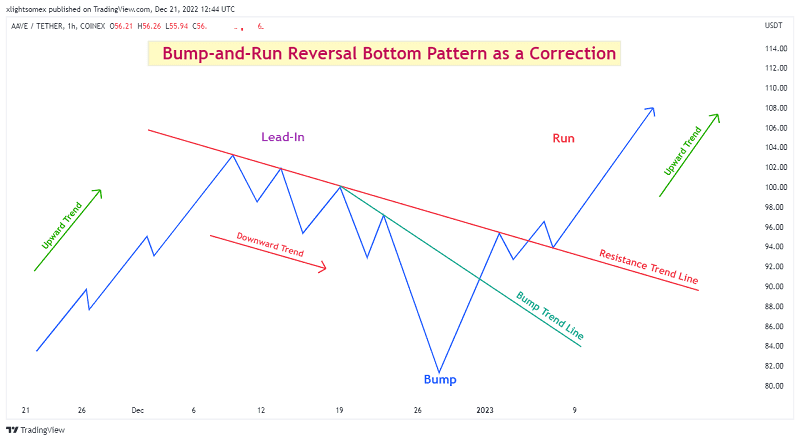
The bump-and-run bottom correction
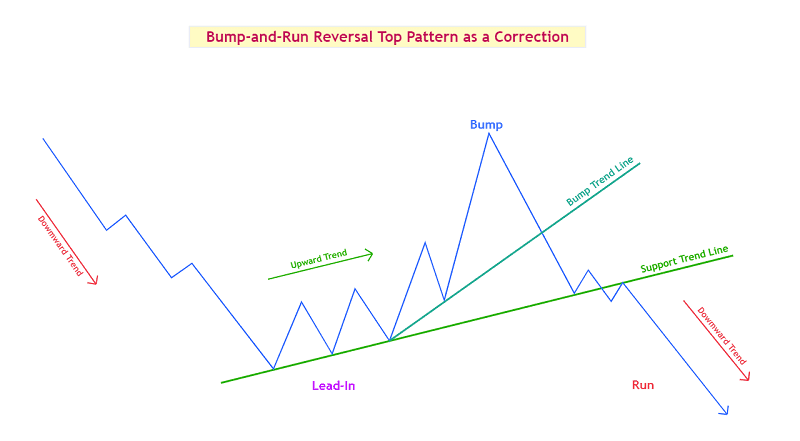
Bump-and-Run Reversal Pattern as a Correction
How is the target calculated?
Measure the distance from the peak, or bump low, to the trend line, and project that same distance beyond the break point.
Which stop placement is best?
There is no single best. A tighter stop improves the reward ratio but is hit more often by noise. Choose based on your actual win rate.
Does the pattern always reverse the trend?
No. On higher timeframes it often corrects an overextended move before the original trend resumes, which is why the target should be the measured move.
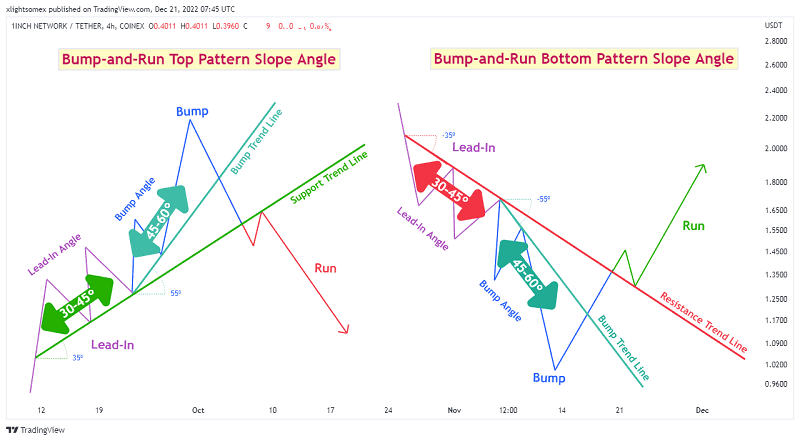
The slope normally ranges
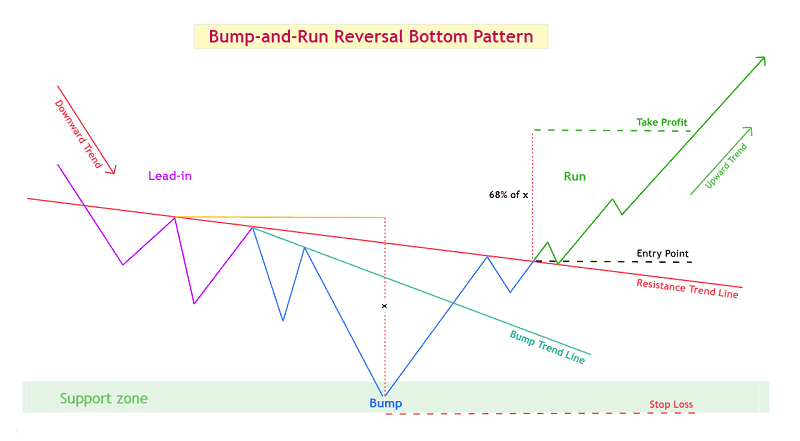
Profit price
Find Your Perfect Broker: Explore Our List Now!
Choose the best with our expert-selected options

Find Your Perfect Broker: Explore Our List Now!
Choose the best with our expert-selected options
Discover top binary options brokers tailored to your region. Browse our curated lists by country: