
10 min

Price charts are not always continuous. Every so often the price leaps between two candles and leaves a hole in the chart. That hole is a gap. Knowing how to identify stocks gaps properly comes down to two questions asked in order: where on the chart did the hole appear, and did volume back it. Get those two right and the four gap types stop looking alike.

Author
Updated October 23, 2026
Price charts are not always continuous. Every so often the price leaps between two candles and leaves a hole in the chart. That hole is a gap. Knowing how to identify stocks gaps properly comes down to two questions asked in order: where on the chart did the hole appear, and did volume back it. Get those two right and the four gap types stop looking alike.
When I first started learning about financial markets, price chart gaps fascinated me. I will take you to the Technical Analysis museum once more to visit the gaps exhibit, and answer the practical questions: what are gaps, why do they form, how do you read one without guessing.
Gaps are upward or downward cut-offs in the price graph. One candle closes at a level, the next opens somewhere else, and nothing traded in between. Most traders can point at a gap. Far fewer can say what it means. The information sits in the psychology behind the hole, not in its size.
“Prices move in cycles of Yin and Yang,” said Munehisa Honma (1724-1803), also known as the God of Markets. People have different opinions about the price regardless of the market’s trend. A gap forms when most market participants have the same opinion and motivation to buy or sell the asset with large enough capital.

Types of Gaps
You can rarely find gaps in forex or commodity markets, and almost never in cryptocurrencies. Unlike the mentioned markets, daily stock market charts form the most gaps. Therefore, they are better practice ranges for beginners to find price chart gaps. The motivation for such large market movements can either be technical or fundamental.
Technical reasons can be the majority of people entering or leaving the market based on the same technical analysis result. As for fundamental motivations, news of a war or an epidemic like COVID-19, an interest rate hike or drop, or asset-related news, in general, can initiate such movements resulting in a gap or a series of gaps in the price chart.
In contrast to how significant it might sound, most gaps get filled with no major effect on the asset price. But what does a fill actually mean, and how does one happen? That is the next stop.
Gap fills happen in almost every market except crypto, not only in stocks. A fill reads in one of two directions, bullish or bearish, and that direction tells you which side of the book ran out of patience first.
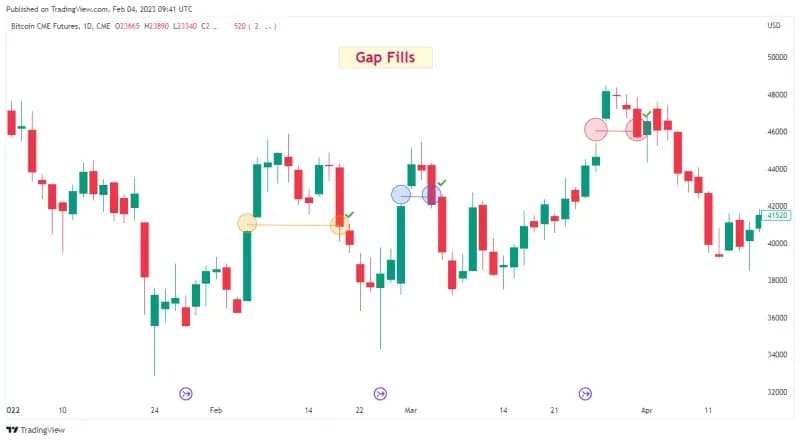
Gaps are not rare events. In fact, they form all the time. When a gap is born on a price chart, the price can not go back in time and fill or close the gap. The gap stays on the chart forever. A gap fill happens when future candles form in the same price range as the gap.
The majority of gaps get filled unless they form around All Time High/Low (ATH/L) of an asset price because the price may never hit that price ever again. The gap fill time also matters; some gap fills happen immediately after the gap with the next following candlesticks.
On the other hand, some gap fills take time. A gap might take days, months, or even years to fill. In such a case, the gap fill doesn’t matter anymore, since everyone who noticed it has forgotten about it.
It is interesting to know that when Bitcoin was initially listed as a stock in Chicago Mercantile Exchange (CME), its price chart formed gaps, most of which were filled afterward. I suggest you investigate more in my article about the Bitcoin roadmap. Now that we know enough about gaps and how they get filled, It is time to visit the promised gap types of exhibits.
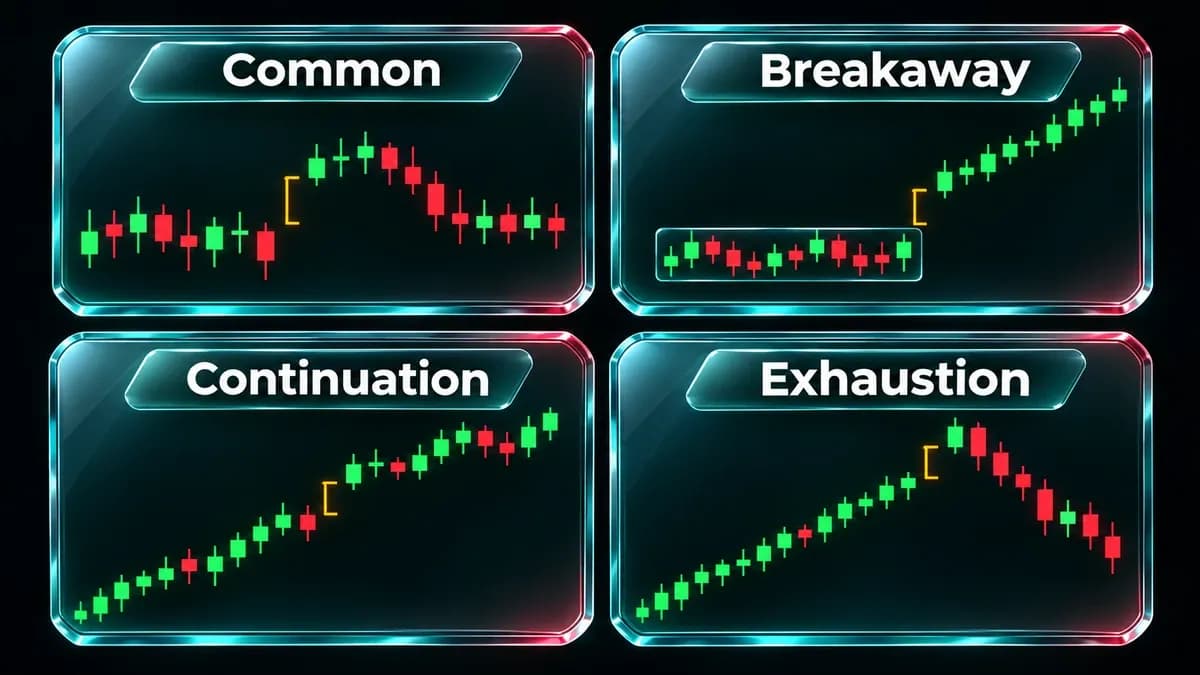
Gaps are either upward or downward, and the names follow: gap ups and gap downs. The label carries nothing beyond direction. What matters is the type. Four of them show up on stock charts, and the list starts with the most frequent one, the Common gap.
Common gap
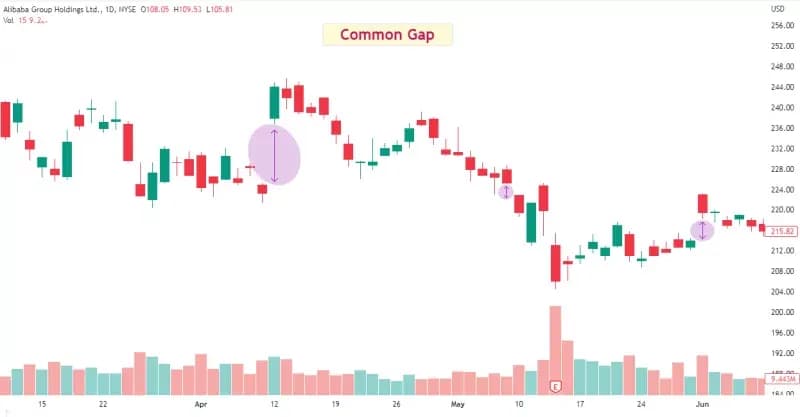
This type is the most common among all four, as the name suggests. Common gaps form in both upward and downward directions. These gaps form on charts even without major news or predictable events or movements. As with fundamental factors, there are few to no technical factors backing up Common gaps.
For example, you won’t see much volume increase (if any) backing the Common gaps. Because technical and fundamental factors do not back a Common gap, the following candles fill the gap soon after its birth. Now that you know about Common gaps, let’s move on to some gap types that are less common.
Runaway gaps
Gap types of exhibits
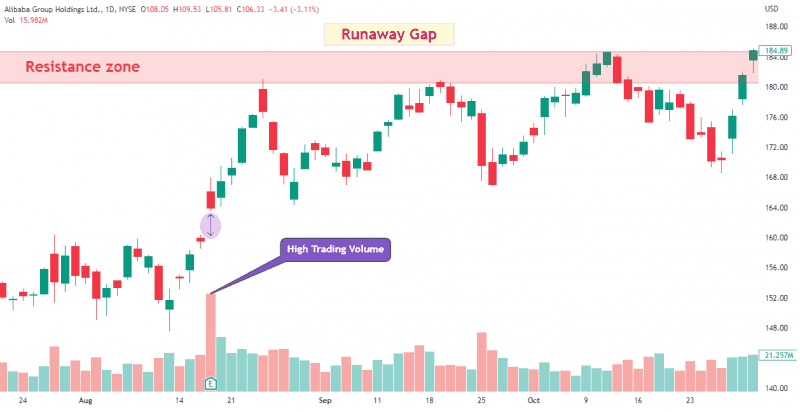
Unlike Common gaps, Runaway gaps are backed by high trading volume. A Runaway gap forms when the price is in such a strong upward or downward trend that it jumps up or drops down and leaves a hole between candles. Telling one from a Common gap is not obvious at first glance. The answer is always in the volume histogram: Runaway gaps sit under tall red or green columns, Common gaps do not. Direction does not change that rule. Volume has to rise either way.
Whenever a Runaway gap forms, the price will likely keep trending in the gap direction. A Runaway gap inside an upward trend usually means the move continues, which is why these are also known as Continuation gaps. They mostly appear in the middle of a trending market, and often alongside continuation patterns such as the Ascending/Descending Triangle and Long Island.
No matter how strong the trend is, major support and resistance levels sometimes stop the price from moving further. The next gap type is the one that breaks straight through them.
Breakaway gaps
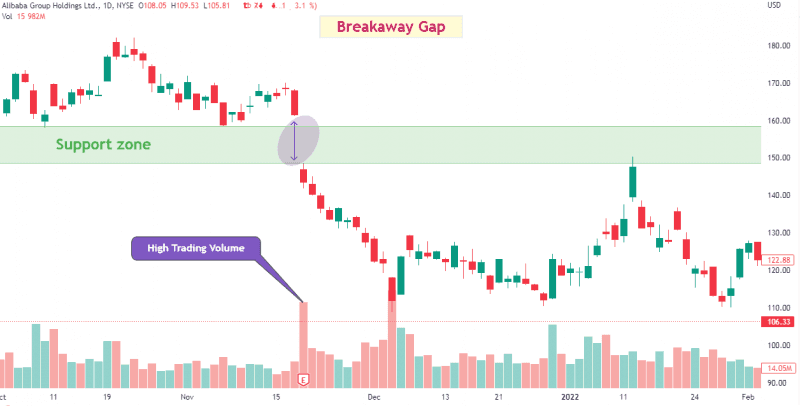
As with Runaway gaps, Breakaway gaps are also backed by high trading volume. The Breakaway gaps form when a gap breaks an important zone, such as support/resistance zones or trendlines. When an asset is being traded in an established range, and a gap kicks the candles outside the range borders, that gap is a Breakaway gap.
Breakaway gaps also tend to start strong market trends. Therefore, they are associated with valid and reliable market reversals. Breakaway gaps can also be combined with classic patterns such as Triangles, Wedges, Cup and Handle, Rounded top/bottom, Head and Shoulder pattern, etc. A Breakaway gap basically confirms the reversal patterns’ validity.
High trading volume next to a Breakaway gap is the confirmation you want. It says the price will likely keep trending in the direction the gap opened, instead of snapping back into the old range.
Sometimes a gap cannot break the support or resistance level standing in front of it. Instead it respects that level and turns the market around. That brings us to the last type on the list, the Exhaustion gap.
Exhaustion gaps
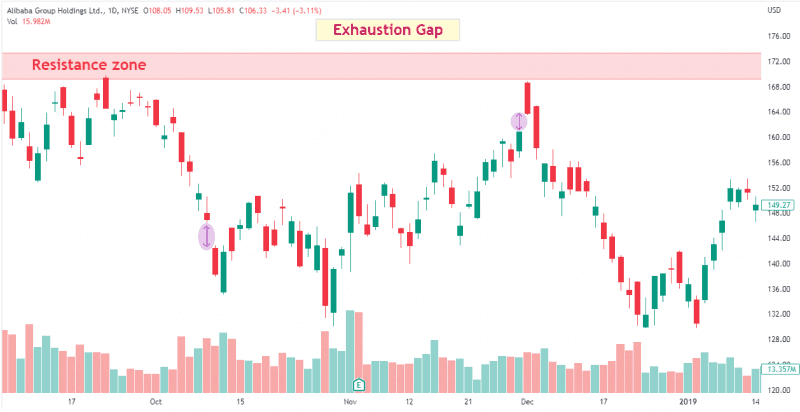
The Exhaustion gap is unlike any other gap in the gaps family; although it is not a Common gap, it demands lower than average trading volume. These gaps form either before a market reversal or start one. When the price stays upward or downward for a while, the trend reaches its final days; as Dr. Nirvadha Singh stated, “Everything in this world has an expiry, some sooner than others.”
In the upward trend of the last few days, the price has gone so high that most bulls don’t want to buy anymore. On the other hand, sellers click the “sell” button confidently. Buyers’ last push might cause the price chart to gap up with insignificant trading volume before pivoting soon later.
If the gap’s following candles form candlestick patterns like Doji Shooting Star or Three Black Crows, it increases the chance of a reversal. As for downward trend Exhaustion gaps, you just have to reverse everything I said about upward trend exhaustion gaps.
Remember that the Exhaustion gaps are expected to get filled shortly after they form. The Exhaustion gaps getting filled, plus low trading volume, is how you can separate them from Breakaway gaps.
Take a chart where a stock closes at 48.00 and opens the next session at 51.20. The hole between those two prints is your gap up. Now run the checklist. Where is it? If the price had drifted sideways for weeks, the hole is most likely a Common gap and the next candles will close it. If it sits just above a range top that held three times, you are looking at a Breakaway gap. If the stock has already run for two weeks, the same hole is a Runaway gap.
Then check the volume column under the gap candle. A tall column, well above the recent average, means real participants moved. A flat one at the end of a long trend points to an Exhaustion gap. Finally, decide what would prove you wrong. A Breakaway gap that fills back inside the old range was never a breakaway.
Common gaps
Runaway gaps
Breakaway gap
Exhaustion gaps
Three errors repeat constantly. The first is treating every hole as a signal. Most Common gaps come from a thin overnight session and close by lunchtime. The second is ignoring which market you are in: stock charts gap far more often than the alternatives, which is why they make the better practice ground. The third is trading the gap instead of the level it touched. Without that context the size of the hole tells you nothing.
One habit is worth building early. Note how long each fill took. Two candles and eight months are different events.
Gap reading is cheap to practise and hard to fake. Pull up six months of daily charts on any liquid stock, mark every hole, and label each one with the four types above. Do that on thirty charts and theory turns into recognition. You also need somewhere to run those charts, and the platform matters more than the strategy here: order types, data quality and the way volume is drawn all change what you can see. Our broker comparison covers the charting side of each platform. If you are still choosing, the shortlist of regulated brokers is the faster starting point. Compare brokers by chart tools before you fund an account, not after.
Ask two questions in order. Where did the hole form: inside a range, at a broken level, or mid trend? And what did volume do on that candle? Location narrows the type down to two candidates. Volume picks the winner.
Look under the candle. A Runaway gap prints a tall volume column well above the recent average, in either direction. A Common gap does not. Common gaps also fill quickly, often within a few candles, while a Runaway gap leaves the hole open and keeps going.
Reacting to every hole on the chart, when most of them are noise. Reading a gap in isolation instead of against the level it crossed. And skipping the fill clock: a gap closed in two candles carries a different message from one that takes months.
As a reading skill, yes. Daily stock charts produce plenty of gaps, so practice material is free. As a trading strategy it is harder, because entries sit where spreads widen and overnight risk is highest. Learn to label gaps first, trade them later.
Find Your Perfect Broker: Explore Our List Now!
Choose the best with our expert-selected options


Find Your Perfect Broker: Explore Our List Now!
Choose the best with our expert-selected options
Discover top binary options brokers tailored to your region. Browse our curated lists by country:
411
