Updated:November 13, 2026

8 min

0
How the RSI indicator works: formula, settings and divergence
The RSI indicator measures the balance of recent upward and downward price changes on a scale from 0 to 100. Traders often watch 70 and 30 as overbought and oversold thresholds, but the numbers are easily misread. RSI does not say that a market must reverse at 70 or bounce at 30. The useful questions are whether momentum is strengthening, whether a trend is losing force and where the reading sits relative to price structure.

Mikhail Vishnyakov
Author

Updated November 13, 2026
RSI meaning: what the relative strength index measures
RSI stands for Relative Strength Index, developed by J. Welles Wilder. It compares average gains with average losses over a selected period. Unlike comparing one stock with another, RSI uses price changes within the same instrument. That is why the phrase "relative strength" can be confusing. An RSI of 60 says recent upward changes have outweighed downward changes in the chosen calculation; it does not mean the asset outperformed the market by 60%.
The indicator appears below a price chart as an oscillating line. High readings describe stronger recent gains, and low readings describe stronger recent losses. Price can continue trending while RSI remains near an extreme. Treat the reading as context. A stock holding above its rising 50-day average with RSI near 65 tells a different story from a falling stock briefly reaching RSI 65 during a violent short-covering rally.
RSI formula and calculation step by step
The standard formula is RSI = 100 - 100 / (1 + RS), with RS = average gain / average loss. Wilder's smoothing method uses prior average gains and losses when new bars arrive. The common 14-period version does not discard the entire history after each candle, so a hand calculation based only on the last fourteen changes may not match a long-running chart exactly.
A simple RSI calculation
Assume average gain is 0.60 and average loss is 0.40 for the relevant Wilder-smoothed period. Relative strength is 0.60 / 0.40 = 1.5. RSI becomes 100 - 100 / 2.5 = 60. If gains and losses were equal, RS would equal one and RSI would equal 50. If the average loss approaches zero while gains remain positive, RSI moves toward 100.
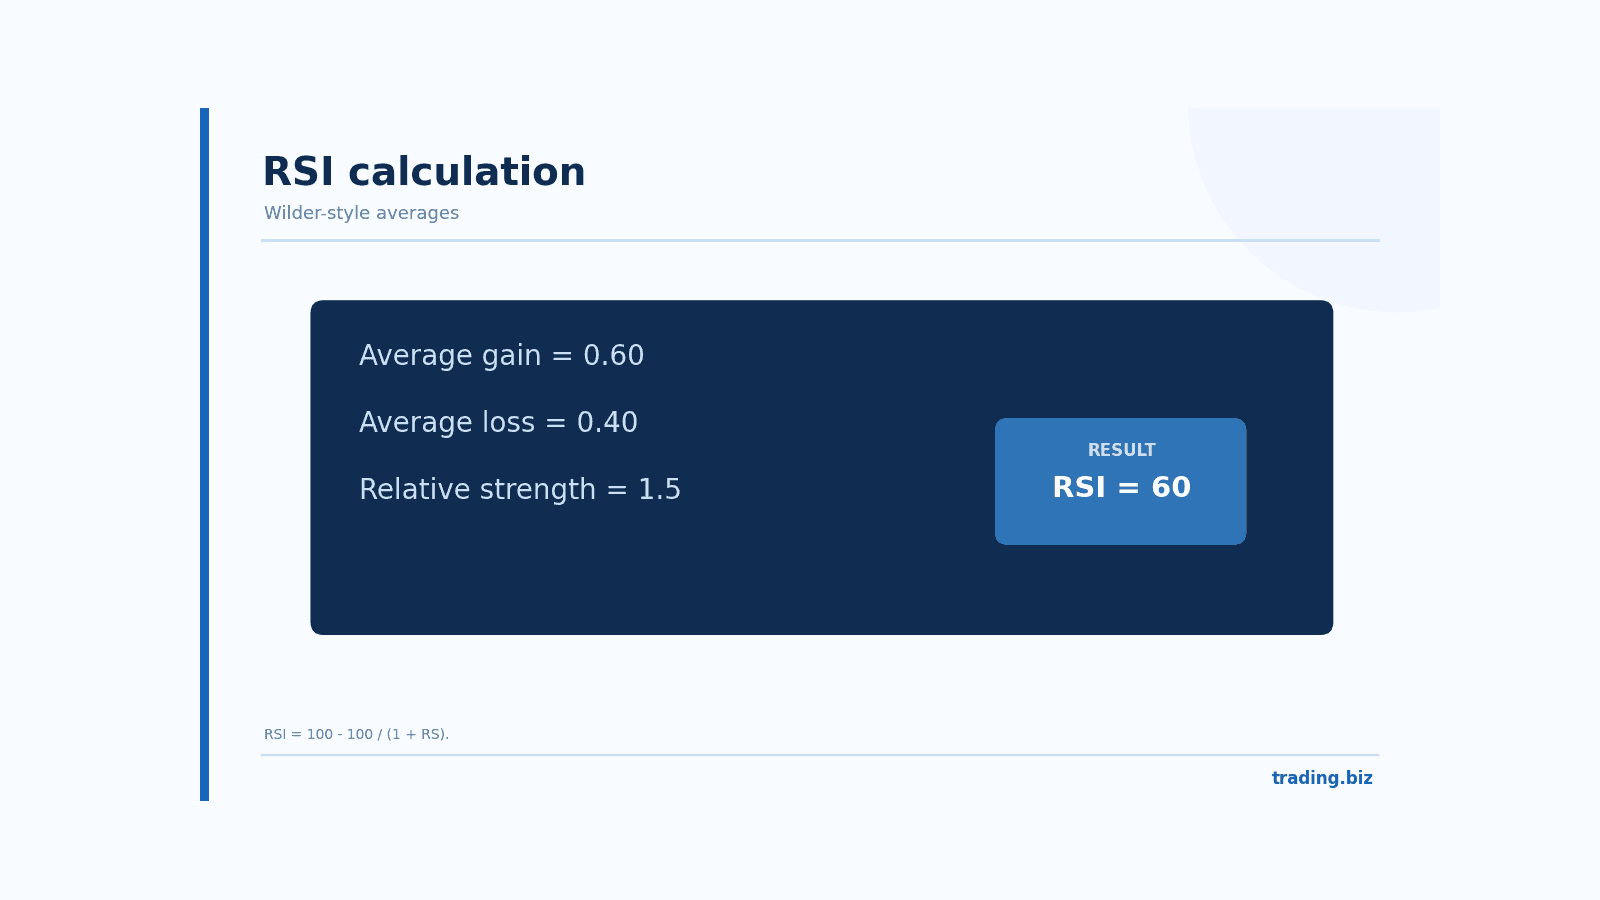
Figure 1. RSI calculation from average gains and losses.
This arithmetic explains why RSI is not a prediction engine. It is a transformed summary of price changes that already happened. More sharply rising prices usually produce stronger readings, while sideways movement can pull the line toward the middle. Different vendors can display slight differences during their initial warm-up period.
Standard RSI settings and when to change them
Fourteen periods remain the most widely used default. Reducing the period to seven makes RSI react faster and swing toward extremes more often. Increasing it to twenty-one makes the line smoother. Neither change improves every strategy. A fast RSI on a five-minute chart can generate a blizzard of signals during noisy trading. A slower version on a daily chart may be more useful for broad momentum context.
Use the timeframe to define the observation window. Fourteen bars on an hourly chart represent fourteen hours of hourly price changes, not fourteen days. A common testing mistake is copying settings from an M5 tutorial to a daily chart without asking what the shorter window was meant to measure.
RSI and moving averages
Some traders use a 50-period EMA as a trend filter and RSI to judge pullback momentum. In a rising market, they might watch RSI hold above 40 or 50 during corrections rather than waiting for a textbook 30 reading. That approach can help avoid fighting an established trend, although the thresholds depend on the market and need testing.
How to use RSI: overbought, oversold and trend filters
RSI above 70 is often called overbought. That label describes strong recent gains, not an obligation to sell. During a powerful uptrend, RSI can remain above 70 or revisit it many times. Selling merely because the line crossed the level can mean stepping in front of momentum. Below 30 is the mirror image: strong selling can persist longer than the trader expects.
A more careful setup combines the reading with a price level. Suppose a stock reaches a previously tested resistance band with RSI above 70. That suggests momentum deserves attention, but the trader still needs an entry trigger and invalidation plan. If price pushes through resistance with strong volume, the bearish thesis may be wrong. RSI should not overrule price without evidence.
The RSI centerline as a momentum check
The 50 line is useful in a trend because it roughly separates periods where average gains dominate from those where average losses dominate. Some traders watch for sustained trading above 50 in an uptrend or below 50 in a downtrend. A single cross is a weak signal. Repeated acceptance on one side has more interpretive value, especially when confirmed by structure.
RSI divergence: regular and hidden patterns
A regular bearish divergence occurs when price makes a higher high but RSI makes a lower high. It may indicate that the upward move is losing momentum. A regular bullish divergence shows a lower price low with a higher RSI low. Neither guarantees a reversal. A divergence can repeat for several swings while the market trends, and choosing which two points to compare can be subjective.
Hidden divergence is usually described in the context of trend continuation. In an uptrend, price makes a higher low while RSI makes a lower low. Some traders interpret that as momentum resetting without the price structure breaking. The bearish version reverses the relationships. These labels can be useful shorthand, but a complete trade still needs an entry, stop and exit plan.
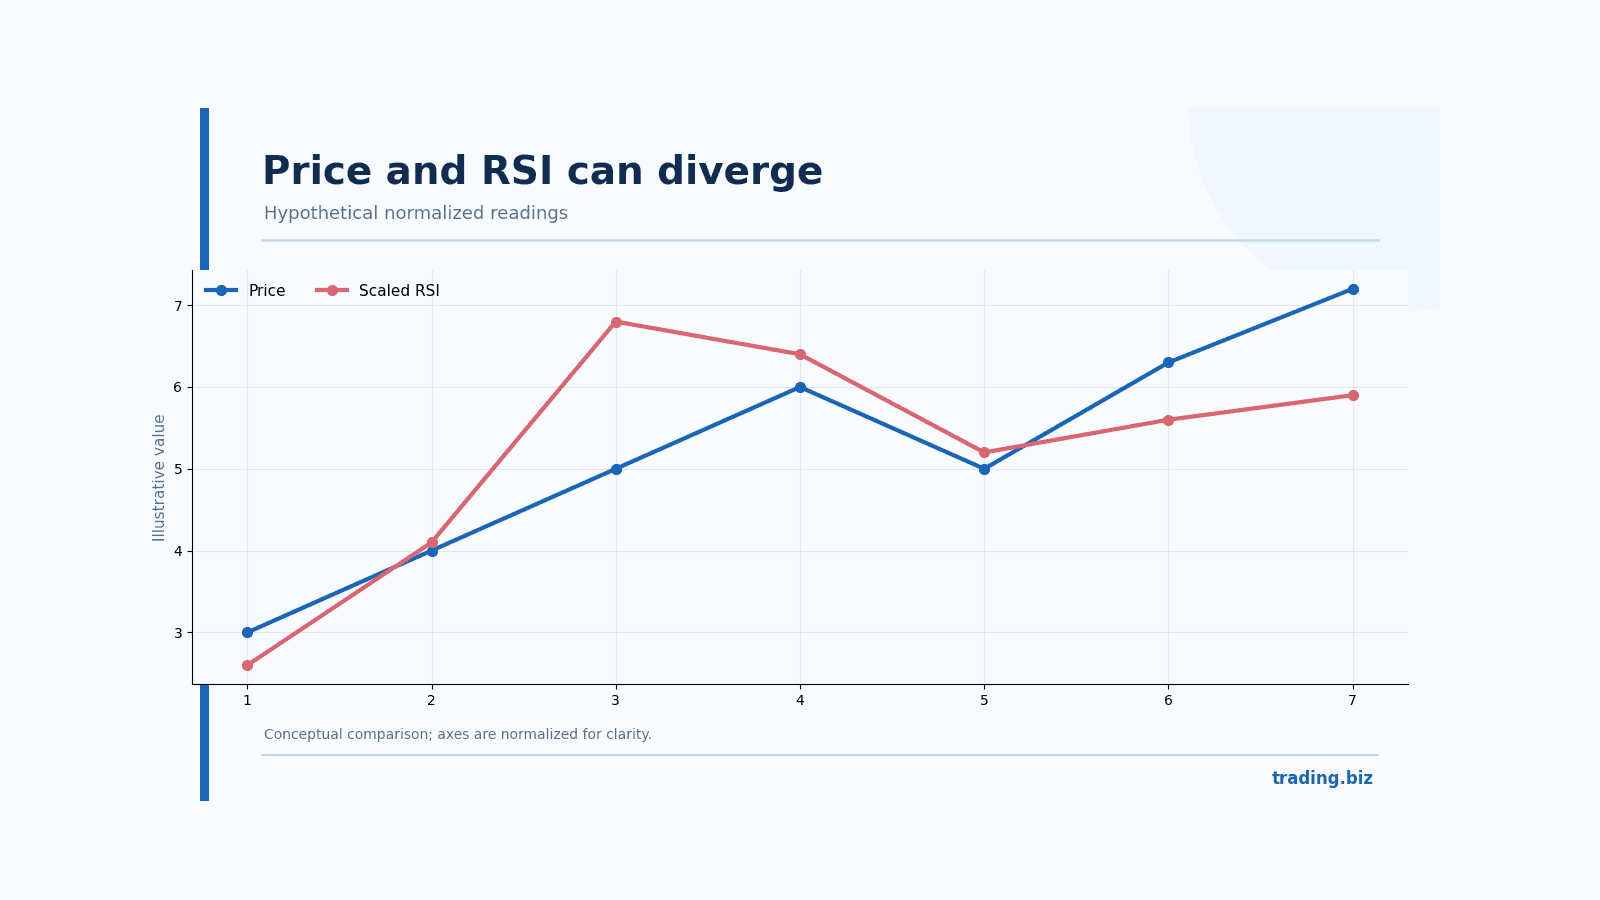
Figure 2. A higher price high can coincide with a weaker momentum high.
Testing divergence without hindsight bias
Mark the two swing points only after the relevant candles are closed. Note the price at which the signal could actually have been acted on. Include divergences that failed or never produced a clean entry, not just textbook reversals chosen months later. Keep sample rules stable so the results are comparable.
Common RSI mistakes and tools to combine with it
The biggest mistake is treating RSI 70 as an automatic sell and 30 as an automatic buy. Another is piling RSI, Stochastic RSI and two other momentum oscillators onto the same chart and counting their agreement as independent confirmation. They often measure similar information. A price level, trend structure or volume analysis may add more than another oscillator.
RSI also lags because it uses historical changes. Increasing sensitivity can reduce some lag but often raises noise. Before modifying the default parameters, calculate how the strategy performs after spreads and slippage. Otherwise, a setting chosen because it looked perfect in hindsight may be worse than the ordinary 14-period line.
RSI and Stochastic RSI are related but different
Ordinary RSI applies Wilder's calculation to price changes. Stochastic RSI applies a stochastic formula to RSI values, comparing the current RSI with the indicator's recent range. This usually makes Stochastic RSI more sensitive and prone to reaching extremes. A reading of 0.8 on a Stochastic RSI scale does not mean the same thing as an ordinary RSI reading of 80. Check the plotted scale and calculation before interpreting the number.
Using both can be useful for a narrow timing experiment, but it also risks counting nearly the same momentum evidence twice. Build the entry rule so you can identify which tool added information rather than merely decorating the chart. If a strategy only looks good after you fit each threshold to the historical sample, test it on later data before drawing conclusions.
RSI divergence across different market regimes
A bullish divergence during a violent downtrend is different from one forming during a quiet pullback into support. The first may be a temporary bounce in a market still making lower highs. The second may align with an existing uptrend and a known demand area. Keep those environments separate in testing. If your record mixes both, a decent average result can conceal a poor setup in one of the regimes.
Do not treat every swing-point disagreement as a divergence. Decide how many bars confirm a swing and whether overlapping highs count. Mark those criteria before replaying the chart. The value of a momentum warning depends partly on whether two people using the same rules would identify it consistently.
FAQ about the RSI indicator
What does RSI 70 mean?
It indicates strong recent gains relative to losses in the selected calculation. It does not prove a reversal is imminent. Strong trends can maintain high readings for an extended period.
Is RSI 14 a daily setting?
Fourteen refers to bars on the chosen timeframe. On an H1 chart it uses hourly bars, and on a daily chart it uses daily bars, with Wilder's smoothing.
What is RSI divergence?
It is a disagreement between price swing structure and the RSI's swing structure. Traders use it as a possible momentum warning, not as a guarantee of direction.
Which RSI setting is best for five-minute charts?
There is no universal winner. Faster settings respond sooner but create more noise. Test any setting on the actual market and include all costs.
Can I trade from RSI alone?
You can build rules around it, but the reading alone lacks a complete risk model. Price levels, position sizing and an exit plan remain essential.
Official reference: RSI indicator description
Find Your Perfect Broker: Explore Our List Now!
Choose the best with our expert-selected options

Find Your Perfect Broker: Explore Our List Now!
Choose the best with our expert-selected options
Discover top binary options brokers tailored to your region. Browse our curated lists by country: