Earnings calendar
Track upcoming earnings reports and financial results from publicly traded companies.
Country
Category
Market cap
--
Report time
Show only favourites
| Favourite | ||||||||
|---|---|---|---|---|---|---|---|---|
| Monday, 9 November 2026 | ||||||||
| Pre-Market |  Constellation Energy CorporationCEG | $92.96B | Sep, 2026 | $3.90 | 4 | $3.04 | –Days–Hrs–Min–Sec | |
| Pre-Market | KKR & Co. Inc.KKR | $84.73B | Sep, 2026 | $1.41 | 7 | $1.22 | –Days–Hrs–Min–Sec | |
| Pre-Market |  Barrick Mining CorporationB | $60.81B | Sep, 2026 | $0.78 | 6 | $0.58 | –Days–Hrs–Min–Sec | |
| Pre-Market |  Ferguson Enterprises Inc.FERG | $46.17B | Sep, 2026 | $3.28 | 3 | $2.84 | –Days–Hrs–Min–Sec | |
| Pre-Market |  ORIX CorporationIX | $40.13B | Sep, 2026 | - | - | $0.99 | –Days–Hrs–Min–Sec | |
| Pre-Market | Roivant Sciences Ltd.ROIV | $26.66B | Sep, 2026 | - | 1 | - | –Days–Hrs–Min–Sec | |
| Pre-Market | NRG Energy, Inc.NRG | $20.19B | Sep, 2026 | $3.44 | 3 | $2.75 | –Days–Hrs–Min–Sec | |
| Time Not Supplied |  KE Holdings IncBEKE | $20.01B | Sep, 2026 | $0.21 | 2 | $0.10 | –Days–Hrs–Min–Sec | |
| Pre-Market |  Joint Stock Company Kaspi.kzKSPI | $17.28B | Sep, 2026 | $3.12 | 1 | $2.72 | –Days–Hrs–Min–Sec | |
| Pre-Market | RB Global, Inc.RBA | $16.29B | Sep, 2026 | $0.93 | 2 | $0.43 | –Days–Hrs–Min–Sec | |
| Time Not Supplied |  POSCO HOLDINGS INC.PKX | $16.08B | Sep, 2026 | $1.29 | 1 | $0.94 | –Days–Hrs–Min–Sec | |
| Pre-Market | Somnigroup International Inc.SGI | $14.63B | Sep, 2026 | $1.06 | 5 | $0.95 | –Days–Hrs–Min–Sec | |
| Pre-Market | CNH Industrial N.V.CNH | $14.56B | Sep, 2026 | $0.10 | 8 | $0.08 | –Days–Hrs–Min–Sec | |
| Time Not Supplied | Summit Therapeutics Inc.SMMT | $12.82B | Sep, 2026 | - | 3 | - | –Days–Hrs–Min–Sec | |
| Pre-Market | TG Therapeutics, Inc.TGTX | $9.36B | Sep, 2026 | $0.37 | 4 | $2.43 | –Days–Hrs–Min–Sec | |
| Pre-Market | Praxis Precision Medicines, Inc.PRAX | $7.98B | Sep, 2026 | - | 8 | - | –Days–Hrs–Min–Sec | |
| Time Not Supplied | Belite Bio, IncBLTE | $6.23B | Sep, 2026 | - | 3 | - | –Days–Hrs–Min–Sec | |
| Pre-Market | Immunovant, Inc.IMVT | $6.03B | Sep, 2026 | - | 6 | - | –Days–Hrs–Min–Sec | |
| Pre-Market | RadNet, Inc.RDNT | $5.78B | Sep, 2026 | $0.21 | 4 | $0.20 | –Days–Hrs–Min–Sec | |
| Pre-Market | Kodiak Gas Services, Inc.KGS | $4.75B | Sep, 2026 | $0.64 | 5 | $0.36 | –Days–Hrs–Min–Sec | |
| Time Not Supplied |  Telecom Argentina Stet - France Telecom S.A.TEO | $4.57B | Sep, 2026 | $0.32 | 2 | - | –Days–Hrs–Min–Sec | |
| Time Not Supplied | Tidewater Inc.TDW | $4.35B | Sep, 2026 | $0.64 | 1 | $0.53 | –Days–Hrs–Min–Sec | |
| Pre-Market |  monday.com Ltd.MNDY | $4.1B | Sep, 2026 | $0.49 | 3 | $0.25 | –Days–Hrs–Min–Sec | |
| Time Not Supplied | Surgery Partners, Inc.SGRY | $3.04B | Sep, 2026 | - | 2 | $0.11 | –Days–Hrs–Min–Sec | |
| Pre-Market | Via Transportation, Inc.VIA | $2.97B | Sep, 2026 | - | 5 | - | –Days–Hrs–Min–Sec | |
Constellation Energy Corporation
CEGMarket Cap$92.96BFiscal QuarterSep, 2026EPS Forecast$3.90Last Year EPS$3.04# Estimates4KKR & Co. Inc.
KKRMarket Cap$84.73BFiscal QuarterSep, 2026EPS Forecast$1.41Last Year EPS$1.22# Estimates7Barrick Mining Corporation
BMarket Cap$60.81BFiscal QuarterSep, 2026EPS Forecast$0.78Last Year EPS$0.58# Estimates6Ferguson Enterprises Inc.
FERGMarket Cap$46.17BFiscal QuarterSep, 2026EPS Forecast$3.28Last Year EPS$2.84# Estimates3ORIX Corporation
IXMarket Cap$40.13BFiscal QuarterSep, 2026EPS Forecast-Last Year EPS$0.99# Estimates-Roivant Sciences Ltd.
ROIVMarket Cap$26.66BFiscal QuarterSep, 2026EPS Forecast-Last Year EPS-# Estimates1NRG Energy, Inc.
NRGMarket Cap$20.19BFiscal QuarterSep, 2026EPS Forecast$3.44Last Year EPS$2.75# Estimates3KE Holdings Inc
BEKEMarket Cap$20.01BFiscal QuarterSep, 2026EPS Forecast$0.21Last Year EPS$0.10# Estimates2Joint Stock Company Kaspi.kz
KSPIMarket Cap$17.28BFiscal QuarterSep, 2026EPS Forecast$3.12Last Year EPS$2.72# Estimates1RB Global, Inc.
RBAMarket Cap$16.29BFiscal QuarterSep, 2026EPS Forecast$0.93Last Year EPS$0.43# Estimates2POSCO HOLDINGS INC.
PKXMarket Cap$16.08BFiscal QuarterSep, 2026EPS Forecast$1.29Last Year EPS$0.94# Estimates1Somnigroup International Inc.
SGIMarket Cap$14.63BFiscal QuarterSep, 2026EPS Forecast$1.06Last Year EPS$0.95# Estimates5CNH Industrial N.V.
CNHMarket Cap$14.56BFiscal QuarterSep, 2026EPS Forecast$0.10Last Year EPS$0.08# Estimates8Summit Therapeutics Inc.
SMMTMarket Cap$12.82BFiscal QuarterSep, 2026EPS Forecast-Last Year EPS-# Estimates3TG Therapeutics, Inc.
TGTXMarket Cap$9.36BFiscal QuarterSep, 2026EPS Forecast$0.37Last Year EPS$2.43# Estimates4Praxis Precision Medicines, Inc.
PRAXMarket Cap$7.98BFiscal QuarterSep, 2026EPS Forecast-Last Year EPS-# Estimates8Belite Bio, Inc
BLTEMarket Cap$6.23BFiscal QuarterSep, 2026EPS Forecast-Last Year EPS-# Estimates3Immunovant, Inc.
IMVTMarket Cap$6.03BFiscal QuarterSep, 2026EPS Forecast-Last Year EPS-# Estimates6RadNet, Inc.
RDNTMarket Cap$5.78BFiscal QuarterSep, 2026EPS Forecast$0.21Last Year EPS$0.20# Estimates4Kodiak Gas Services, Inc.
KGSMarket Cap$4.75BFiscal QuarterSep, 2026EPS Forecast$0.64Last Year EPS$0.36# Estimates5Telecom Argentina Stet - France Telecom S.A.
TEOMarket Cap$4.57BFiscal QuarterSep, 2026EPS Forecast$0.32Last Year EPS-# Estimates2Tidewater Inc.
TDWMarket Cap$4.35BFiscal QuarterSep, 2026EPS Forecast$0.64Last Year EPS$0.53# Estimates1monday.com Ltd.
MNDYMarket Cap$4.1BFiscal QuarterSep, 2026EPS Forecast$0.49Last Year EPS$0.25# Estimates3Surgery Partners, Inc.
SGRYMarket Cap$3.04BFiscal QuarterSep, 2026EPS Forecast-Last Year EPS$0.11# Estimates2Via Transportation, Inc.
VIAMarket Cap$2.97BFiscal QuarterSep, 2026EPS Forecast-Last Year EPS-# Estimates5
Show:
Showing 1 - 25 of 1176
An earnings calendar is a list of report dates for publicly traded companies. It shows EPS estimates, past results and the move the options market expects. Some traders type earnings calender with an e, and it is the same tool. This page explains how to read the table, where the expected move figure comes from, and how to trade around a release without getting run over by a gap.
Updated October 23, 2026
The calendar itself sits above this text. Pick a ticker or a date. The table then shows when the report lands, what analysts expect, and how far the stock is priced to travel. The sections below walk through the columns and finish with a worked example.
What is the earnings calendar?
Start with the basics. An earnings calendar tells you when a company will publish quarterly profits. Few scheduled events move a single stock as reliably. That is why traders build the week around the dates in it.
An earnings calendar is a list of the quarterly financial report publication dates. The earnings calendar shows when each company will reveal quarterly profits. It offers information on the performance of publicly listed businesses. Sales, expenses, net income, and earnings per share are all included.
Earnings per share (EPS) highlights freshly released statistics. It is because it allows for a quick assessment of company performance. EPS is a critical instrument for making business investment decisions. EPS is one of the pillars used to assess the value of a stock.
It denotes profit, growth, and relative performance. These announcements come in the months after the end of a fiscal quarter. Not every company releases their statistics on the same day. The calendar depicts the company’s performance over the previous months.
An earnings calendar is essential for analysts, investors, and traders alike. During the earnings season, it keeps them up to date. As the release dates near, traders draw their attention to several stocks.
Also, does it appear that the corporation made a profit or not? Do stocks usually rise following an earnings report? The stock rises if the market hasn’t priced in the positive earnings.
A weak print pushes the price down and sends holders to the exit. Either way, expected volatility climbs as the report date approaches. There are hundreds of earnings calendars online, and they differ in which columns they publish.
How to use an earnings calendar?
Earnings reports can reshape a position whatever your holding period. That is the argument for keeping a calendar open. It saves you from hunting through press releases for a date that was public all along.
Let me give you an example. If earnings beat the forecast, the price usually rises. If the result lands close to the estimate, the price often barely moves, because the number was already in the price. What matters is the gap between the print and the expectation, not the size of the profit.
Most of the earnings-related price movement happens during the trading day that follows the release. Some of it arrives earlier, while the market rewrites its expectations. The size of that move is exactly what the calendar tries to estimate in advance.
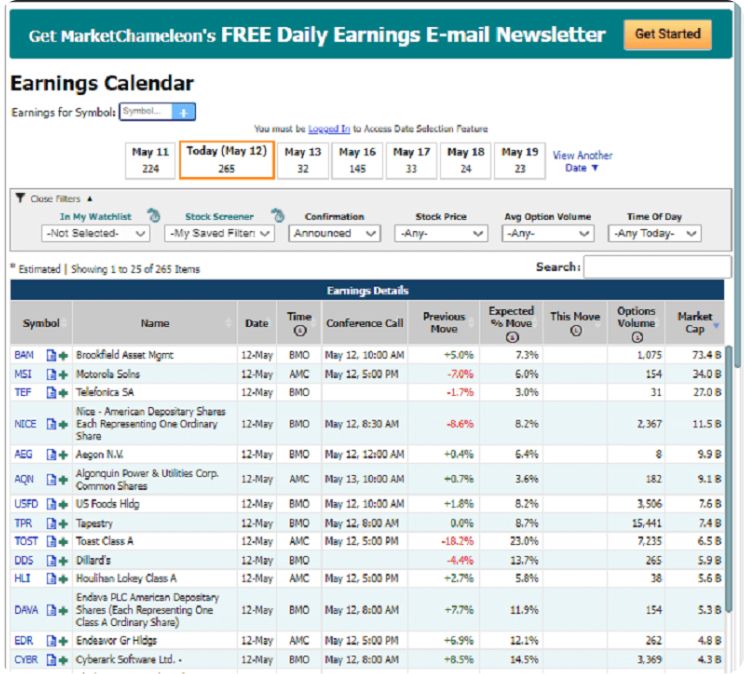
image 2.jpg
The Expected per cent Move column shows how far the market thinks the stock will travel. The figure comes from at-the-money straddle options that expire right after the earnings date. It is a market estimate, not a forecast from the site.
The straddle transforms into a percentage change in either direction. It is the forecast movement if the stock rises or falls. Stock fluctuation happens after the firm reports earnings. Options are often priced based on the market’s expected earnings volatility. Thus options traders will trade based on the amount of the stock change
If a trader feels the options market is overestimating, he’ll sell the straddle. If a trader thinks that the options market underestimates, he’ll buy the straddle. Due to earnings, traders expect a significant gain or loss in the stock price.
How the expected move is calculated

image (7).png
The expected move is not an opinion. It is arithmetic on option prices. Take the at-the-money call and the at-the-money put that expire just after the report, add the two premiums, and divide the sum by the share price. The result is the percentage move the options market is pricing in, in either direction.
Expected move, per cent = (at-the-money call premium + at-the-money put premium) / share price x 100
Expected range = share price plus or minus (call premium + put premium)
A worked example with round numbers. A stock trades at $200 two days before earnings. The nearest call after the report costs $6.00, the matching put costs $5.50. The straddle is $11.50. Divide by 200 and you get 5.75 per cent. So the market is pricing a move to roughly $188.50 on the downside or $211.50 on the upside, and it does not say which. If the stock finishes at $206, the move was 3 per cent, smaller than priced, and the option seller was right.
Two caveats. The straddle price already carries the volatility premium, so the expected move usually overstates the typical result. And you need a broker that shows you an options chain to check the figure yourself. If you do not have one, compare the terms in our broker list before the next season starts.
How to read the Trading.biz earnings calendar?
Earning’s calendar enables traders to receive data regarding the profitability of companies at a particular time. Did you know this is also a tool for technical analysis?
The earnings calendar also makes forecasting effective. To interpret the earning’s calendar, you first need to understand it thoroughly.
Your trading system type determines what the calendar will look like. With the vast data, it may be intimidating and may seem haphazard, but it will all make sense once you get the hang of it.
Go over the different notations and find out what they mean before beginning the process of interpretation. After this, select the desired company, its consequent data segment, and the corresponding date.
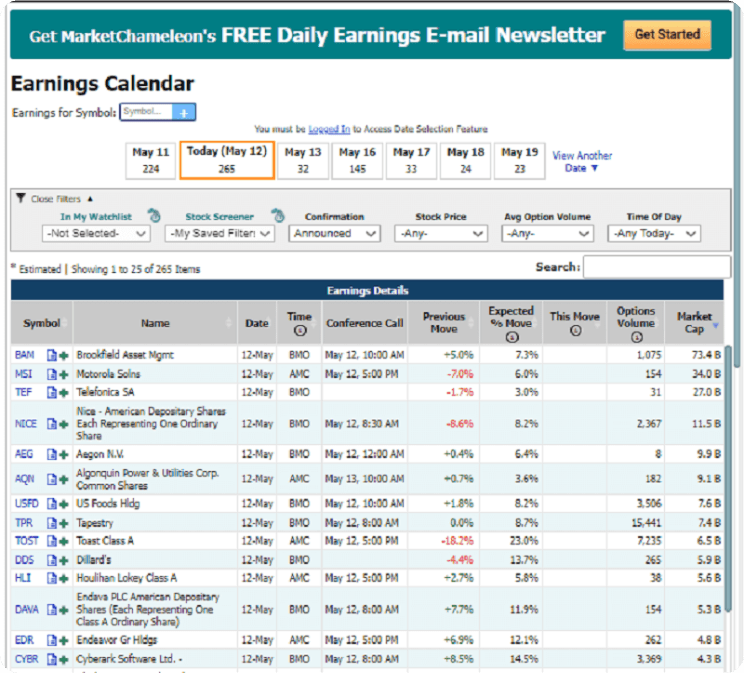
image 4.png
The earnings calendar shows previous moves and future expected moves to give traders an idea of what is to come. The movements are given in percentages and also indicate whether the percentage has or will increase or not. If you look closely, there are separate columns for “market cap” and “options volume”.
There are also columns for “press release”, “time”, “this move”, and “conference call.” We use mathematical means to collect the desired data. For best use, use the earnings calendar with other types of technical analysis. The best part is that the earnings calendar does not have any restrictions.
We can use it in various trading options, such as binary, classic and digital options. Professional options traders provide the data of an earnings calendar, so your course of action depends on your choice of the scheme used.
What is an earnings season?
Earnings season is the stretch when companies file Form 10-Q. The report carries the financial record of the most recent quarter. Several hundred names report inside a few weeks, which is why the season feels crowded.
Analysts present on Wall Street may ask questions from companies when they conduct conference calls to discuss the data. Such calls aim to analyze the differences between the actual and expected results formulated before earnings season.
You might think this season has a specific date, but no. Earnings season does not have a particular set date of commencing or even ending. The timings of the season are all dependent upon when the companies (in the US) publicly report their quarterly data.
Although there is no date set in stone for earning season to begin, there are some attributed months to which some companies religiously adhere. These are January, April, July and October.
Some banks disclose the data before Alcoa’s earnings. If you didn’t already know, people considered Alcoa always begin the earning season. The season usually starts after the quarter is finished and has a general pattern explained as follows:
First-quarter earnings season: quarter ends on March 31st, so the earnings season starts mid of April and lasts till May
Second-quarter: June 30th is when the quarter ends; earnings season begins middle of July and ends in August
Third-quarter: the quarter ends September 30th, so the earnings season starts mid-October and runs until November
Fourth-quarter: quarter ends on December 31st, and the earnings season begins in mid-January and ends in late February
How to understand earnings reports?
Earnings reports are public documents, and anyone can read them. The calendar is the index to those documents. This section covers what sits inside a report and where to find the original filing.
The reports contain information about companies’ finances, profits, and overall organization. Whether current or potential, Shareholders can track earning releases that are yet to come through online means.
image (8).png
For example, by using Trading.biz calendar, they can get the information they need. Trading.biz gives a collection of reports of company finances and profits. The cool thing is that you can pick your company of interest by a ticker symbol or release date instead of scrolling through a list of companies to find the one you are looking for.
You will then immediately get a concise overview of the information you have searched for. The Security and Exchange Commission’s website has details of previous earning reports.
You can go through this and search for whatever company you want and read their data. Remember that these companies are not just any companies. They are publicly-traded companies. Their data is supposed to be available to the public.
Again, like before, conference calls can help clear the knots in your thoughts. They will give you a greater depth of information than what you can get by just looking at an earnings report. Such calls can occur over any cellular device.
How the Trading.biz earnings calendar helps you
Forecasting is most of the work in trading. The Trading.biz earnings calendar cuts the research part of it. You get the dates, the expectations and the implied move in one table.
Trading.biz earnings calendar is a useful technical analysis tool. It gives information about a company’s profitability over a specific timeframe.
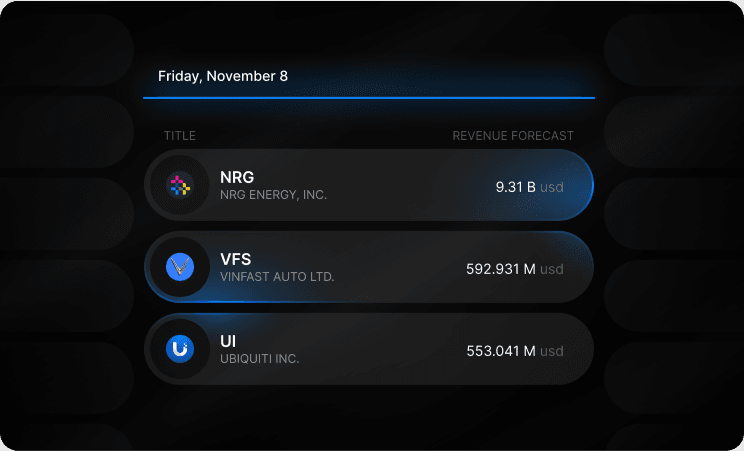
image (9).png
Option traders would love to use this instrument. It enables you to forecast price movements. It also displays the times of conferences and information about press releases. You can also track market percentage changes and volumes.
The earnings calendar also presents insight into the required time intervals. It can help you improve your forecast. You can acquire all of the information you need on price movement predictions. It is a significant instrument for forecasting the trading asset you want to trade.
You may access the required facts on options trading in the company’s context. You can see when transactions will expire and when they will not. You can also determine their fluctuation, rate history, and strike prices. And lastly, you can predict the number of closed deals and the time between them. Both binary and digital options traders will benefit from the earnings schedule.
How to make the most of the earnings calendar?
To start, know the basics of accounting and how to read a profit calendar. You must first pick some settings before you can begin tracking the relevant data.
Choose the firm, the desired data segment, and the criteria you require. It’s preferable to use the calendar in conjunction with your trading strategy.
The data set is wide, and the first look can feel like too much at once. Do not let that stop you. Learn what two or three columns mean, then add the rest. The calendar pays off only when you know which number you are acting on.
The basis of an earning calendar is information from technical analysis. These are mathematically derived figures basically for your convenience. You can use them in conjunction with other comparable tools for technical analysis.
When to use an earnings calendar?
There are no limitations to using this tool. Binary, digital, and conventional options can all benefit from this calendar.
You can also use it for FX and CFD technical analysis. The tool consists of data that you can use to predict the price difference.
We usually use the tool in conjunction with a few others. Everything relies on the circumstances, the trading strategy, and your creativity.
When trading options, the ideal method is to employ this instrument. Expert option traders contribute the data for the earnings calendar.
Final thoughts
An earnings calendar will not tell you which way a stock jumps. It tells you when the jump is scheduled and how big the market thinks it will be. That alone changes position sizing, and it keeps you from holding a full position into a print by accident.
Use it next to a chart and a plan, not on its own. Check the date, read the expected move, decide whether you want to be in the trade at all. If you still need an account with options chains and stock CFDs, start from our broker catalogue and compare the fees first.
FAQ
What is an earnings calendar?
It is a schedule of quarterly report dates for publicly traded companies. Next to each date it carries the EPS estimate, the previous result and the move the options market expects. Traders use it to know when a stock is about to become unpredictable, and to plan entries and exits around that date.
How does the earnings calendar work in 2026?
The calendar pulls confirmed and provisional report dates and puts them next to analyst estimates. You filter by ticker or by date, then read the columns: time of release, market cap, options volume, press release and conference call. The expected move column is recalculated as option prices change.
How is the expected move calculated?
Add the premium of the at-the-money call and the at-the-money put expiring after the report, then divide by the share price. A $6.00 call and a $5.50 put on a $200 stock give 5.75 per cent. That is the move priced in, without any direction attached to it.
What values do I need to enter?
Nothing beyond a filter. Choose the company by ticker symbol, or pick a release date and read everything reporting that day. If you want to check the expected move by hand, you need three numbers from your broker: the share price and the two at-the-money option premiums.
Can I use the earnings calendar for forex and crypto?
Earnings belong to companies, so there is no direct equivalent for a currency pair or a coin. The calendar still matters indirectly: a big miss from a mega-cap moves indices, and index moves spill into risk currencies. For pure FX and CFD timing, use an economic calendar instead.
1
Filter what matters
Narrow down Earnings calendar by date, country, category and other filters. Your selection is kept in the link, so you can bookmark or share it.
2
Your time zone
Times are shown in your browser's time zone. Switch to any other zone or to the 12-hour clock in the filters, and the choice is saved on this device.
3
Live countdown
A countdown next to each upcoming event shows how much time is left, and the current-time line marks where you are in the day.
4
Favourites and reminders
Star events to keep track of them and receive an email 15 minutes before they start. The letter goes to the address on your account and is also saved in your profile notifications.
5
Email digest
Subscribe to Earnings calendar and receive a daily or weekly email with upcoming events at the time you choose.
6
Reliable sources
Data comes from Nasdaq, CoinMarketCap, Binance and official exchange schedules and is refreshed automatically during the day.
