Updated:November 11, 2026

19 min

Master the art of trading with candlestick patterns in 2026
Master the art of trading with candlestick patterns and half the noise disappears from your chart. Start with a simple observation. We all keep things we never use. In financial markets there is no room for that. Imagine a house filled with beautiful and expensive items. If there is so much of it that no space is left for you, can you enjoy any of it? Of course not.

Pejman Zwin
Author

Updated October 23, 2026
Master the art of trading with candlestick patterns and half the noise disappears from your chart. Start with a simple observation. We all keep things we never use. In financial markets there is no room for that. Imagine a house filled with beautiful and expensive items. If there is so much of it that no space is left for you, can you enjoy any of it? Of course not.
Your first tool for trading is your brain. Fill it with useless information and complicated methods, and you will stay confused in the market. That confusion is what ends in trouble. I will help you separate the vital information from the noise. This will help you see and think clearly.
Take a look at any chart you like. What do you see? I see the time and price axes and, most importantly, the candles. The price chart is the first tool any technical trader has to learn. Candlesticks carry almost all the information you need, as long as you understand their language.
Yes, candles talk to you through their shapes. They help you find entry and exit points earlier. That is what makes patterns worth the effort. As you learned in previous articles, three things matter: where the candle forms, what color it is, and which trend it appears in.
Each candle on your chart is the outcome of a battle between buyers and sellers. Each round can run over a different time frame. Perhaps you feel confused and indecisive about your trading. Please do not feel bad about it.
This is normal. It is easy to be unsure about the patterns, and nobody wants to miss the market. I was the same when I started, but practice makes perfect. One number to keep in mind: using the concepts from the previous articles and the ones ahead, I made more than 30% in a single trading period.
You can be even more successful than me by learning and practicing. I will be delighted to hear about your success. Let’s get to know this scoreboard better so that you can competently predict the next rounds of the game.
What are the main points of trading with candlesticks?
As you know, some candles are essential for us. In the financial markets, information becomes valuable only when it helps you trade.
In the previous articles you met the important candle types. Now it is time to use them. I will summarize each one and show you how to trade it.
Bullish candles with a long body and a short shadow indicate more power, and volume validates the strength of an uptrend. It also shows high demand and buyers insisting on their decision. The opposite is true as well. Bearish candles with a long body and short shadow indicate more power, and volume validates the strength of a downtrend.
It also shows that the sellers are dominant in the market. Short, square candles with short shadows and low volume tell us something else. The market is indecisive and neutral. The most important point is where the candle forms. Candles matter far more in crucial areas: dynamic or static support, resistance, or moving average indicators.
A famous saying goes that one out of two candlestick patterns will fail. So we do not rush into loss-making trades. Make sure your prediction holds first, then open the position. Waiting too long costs opportunities, though, so the balance matters.
You might ask, how is that possible? I’ll tell you the ideal entry points with the perfect stop loss spots.
How to use candlestick patterns in your trades?
You have learned in the previous articles that each candlestick has its characteristics, and I have prepared examples for the more important patterns so that you will be ready to trade with any pattern you see on the chart.
As you know, candlestick patterns matter more in specific areas. Find a pattern near support or resistance, and those areas give you better entries and a natural stop loss. In most of the examples below, rising volume adds validity to the pattern.
You will also notice something else. In some examples I mention two or three entry points and stop losses. Use whichever fits your trading system and your risk management. Let us begin step by step.
How to trade according to Doji?
Do you remember what a Doji is? If not, you can check it out and come back after! I will tell you how to trade when you see a Doji. (Near critical areas!)
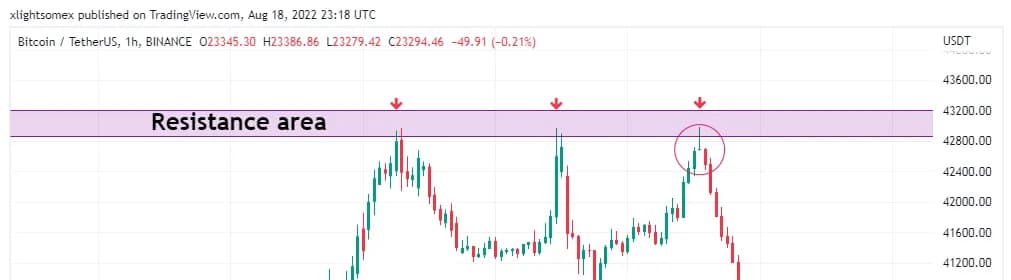
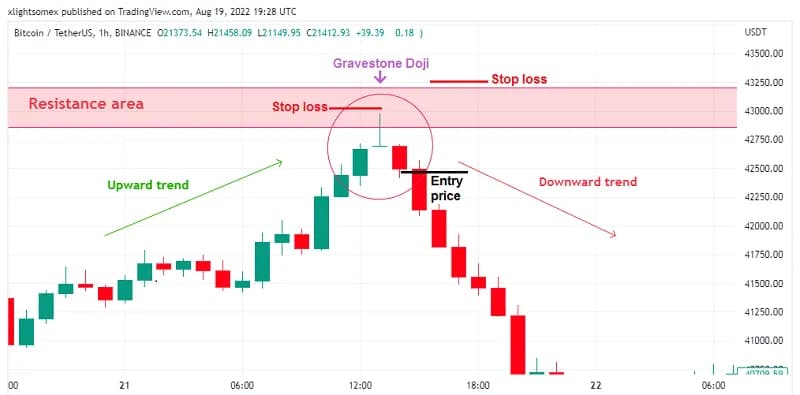
You can see in the chart above that the price is stuck in a resistance area. On the third encounter with it, a Doji candle formed. This one was a Gravestone Doji. Pair candlestick patterns with support and resistance areas and your chances improve.
Doji candles are single candlestick patterns. You might think, “Why should I combine support and resistance levels with candles? I can get more signals by considering the candles and making more money!”
Price patterns repeat on the chart, and they can be wrong. No pattern makes the decision for you on its own. Here you have the resistance area, the Doji itself, and the candles before and after it. That is enough confirmation to enter the position.
I used to think a Doji always caused a reversal. Then I noticed how often this pattern appears on a chart. Without other confirmations it is not very reliable. You can doubt the strength of a trend after a Doji, because this candle forms when the market is unsure about its next move.
It means buyers and sellers got equal points in this round. Let’s take a closer look at the chart below.
When a Doji forms at the end of a downtrend or an uptrend, a reversal becomes more likely. So when I see one in the middle of a trend, I get more careful with an open position. A new entry needs other confirmations first.
You can wait for the next candle before entering, which puts your entry price close to that candle. The stop loss goes at the highest price of the Doji. If the Doji sits at the end of a downward trend, the stop goes at its lowest price instead.
You can see another stop loss above the resistance area. Placing the stop there lowers the chance of getting hit. The price reacted to these areas in the past, so they should be hard to break. Your stop sits behind the support or resistance trench. Price can attack it, but that is not easy.
How to trade according to bullish candlesticks?
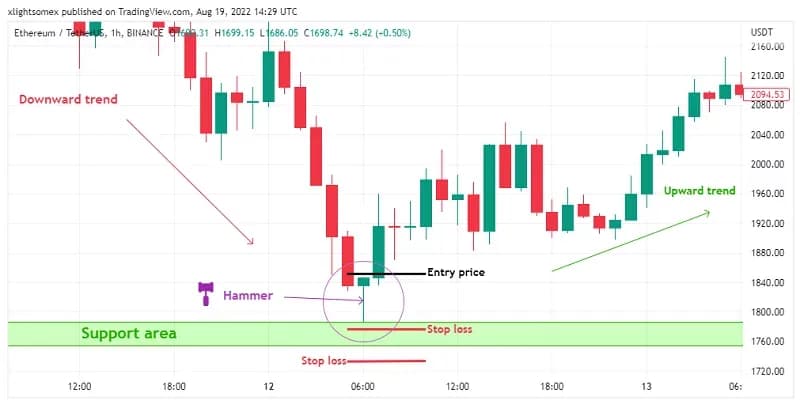
Hammer: A Hammer candlestick is a single Bullish reversal candlestick pattern that forms during a downtrend. It is so named because the market is bottoming out.
Just because you see a Hammer in a downtrend does not mean you buy on the spot. More confirmation is needed. A typical check is to wait for a green candle to close above the opening price of the Hammer.
After the Hammer appears, you can set your entry on that same candle. Place it a little higher than the Hammer, and put your stop loss at the lowest price of the Hammer. You can also place the stop below the support area.
Not always, but usually the stop goes above the resistance area or below the support area. The examples below will make this clear. And this is not the only Hammer in financial markets. It has an opposite twin called the Inverted Hammer.
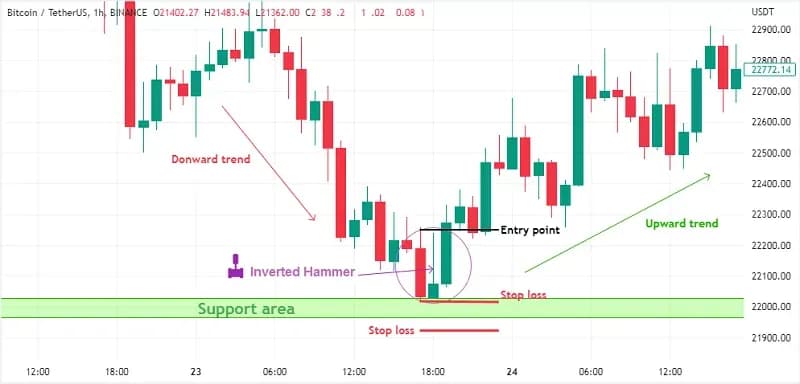
Inverted Hammer: this candle points to a possible change in the direction of the trend. The long shadow above shows that buyers tried to push the price higher after it had fallen.
The sellers watched that and said: no way. They tried to push the price back down. Fortunately the buyers had eaten enough breakfast, and the session closed near the open. The sellers could not close it lower. That suggests everyone who wanted to sell had already sold. And if there is no seller left, then who is there? Buyers.
The same goes for the Inverted Hammer. It appears at the bottom of a downward trend. Your entry is a little above the shadow, at the highest price of the candle. The stop loss goes a little below the candle, under its lowest price.
Like the Hammer, you can place the stop slightly lower than the support area. One condition applies to both patterns. The preceding candles must be red and Bearish.
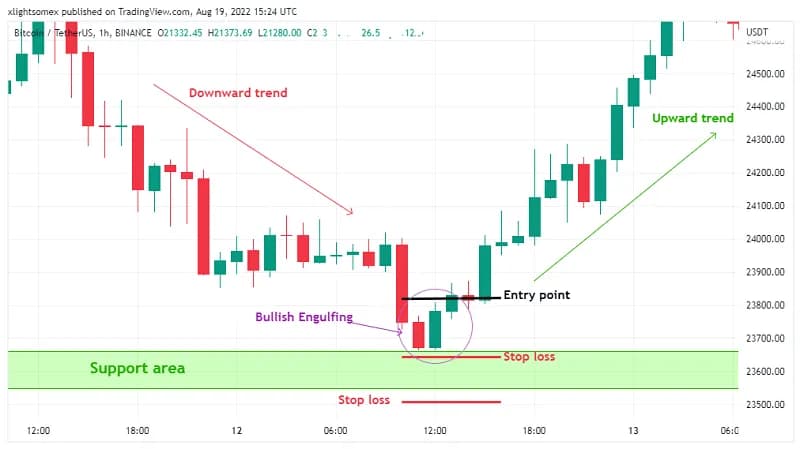
Bullish Engulfing: The Bullish engulfing pattern is a two candlestick pattern.
This pattern occurs when a giant Bullish candlestick immediately follows a Bearish one. The second candle has covered the first. Buyers are warming up. A strong Bullish move may follow the recent downtrend or bottoming period.
Your entry goes above the second candle, once that candle has closed. The stop loss can sit at the bottom of the same candle. Depending on your trading system, you can also put it below the support area.
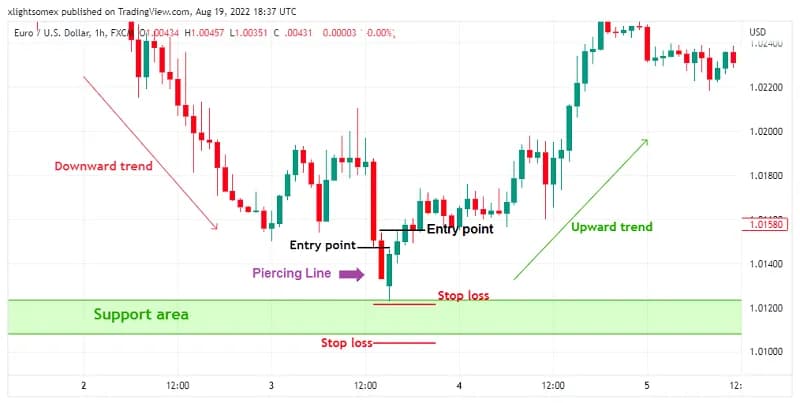
Piercing Line: The piercing line pattern is a two candlestick pattern that appears at the end of a downward trend near a support area, the same as Bullish engulfing.
We wait for the candles to form completely. Once we are sure, the entry goes above the second candle and the stop a little lower than the bottom shadow. You can also set the stop below the support area, as in the other positions.
Also, the volume of the second candle is crucial because it shows the power of the trend.
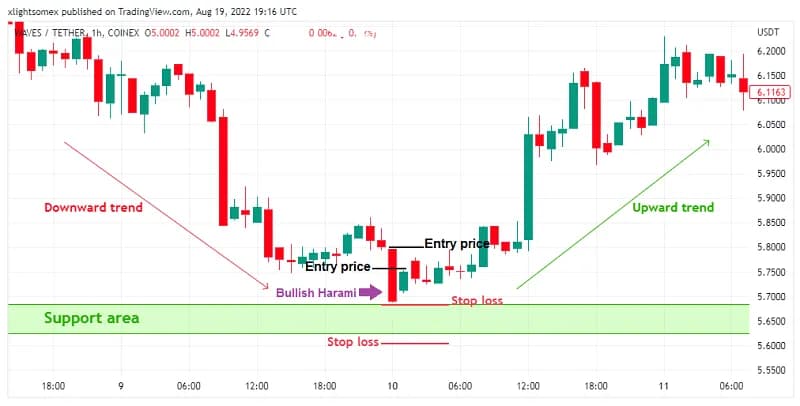
Bullish Harami: A Bullish Harami pattern consists of two candlesticks with contrasting colors side by side.
Harami means pregnant in Japanese. That is why the first candle is called the mother and the second the child. The small candle fits inside the larger one. In the Bullish version the mother wears a red dress and the child wears a green one.
The mother gives birth to whatever she carries, so the second candle sets the trend here. If that green candle forms at the end of a downtrend, it is a buy signal. The other prediction that matters is a slowdown in the price movement.
Your entry goes above the mother or the child candle, after the little one closes. The stop loss sits either below the first candle or below the support area, according to your risk management.
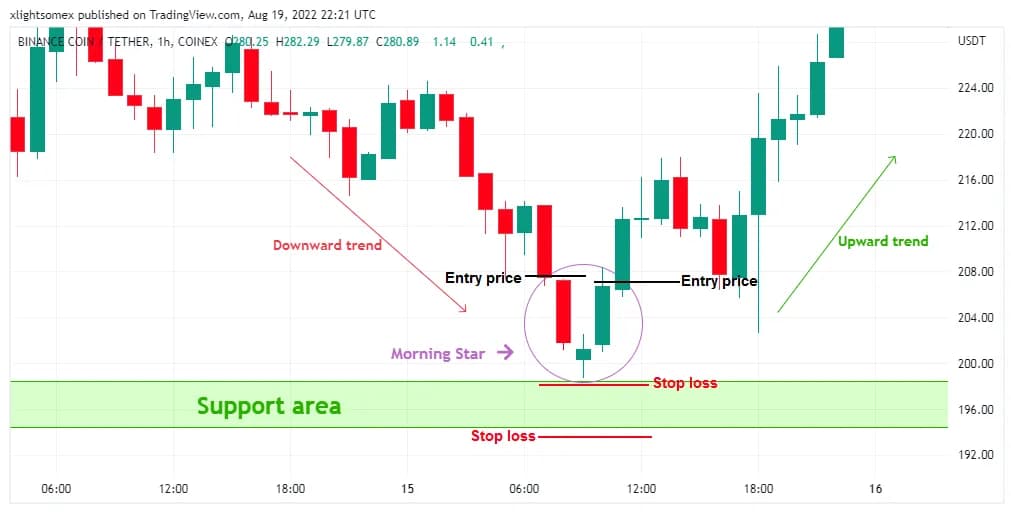
Morning Star: The behavior of the Morning Star pattern is like a ball falling on a large spring and then rebounding rapidly.
The price falls as the candle starts to form. Then buyers step in while sellers keep pushing. It works like a ball on a spring. The Morning Star's shadows are that up and down movement, dropping into a support area and rising again. Here is an example of trading with the Morning Star pattern.
According to your trading system, enter at one of these points. Also, adjust your stop loss according to your risk management principles (below the Doji candle or below the support area).
Three White Soldiers: The Three White Soldier pattern forms when three long Bullish candlesticks form after a downtrend, indicating that the trend has reversed.
This triple candlestick pattern counts as one of the most vital Bullish signals, something like an uppercut. It carries the most weight after an extended downtrend and a short bottoming period.
You can enter slightly higher than the third candle. The stop loss goes somewhere below the first or second candle. You can still place it below the support zone, as in the example above.
A worked example: sizing a hammer trade
Numbers make this concrete, so here is a hypothetical trade built on the rules above. Say EUR/USD prints a hammer at 1.0820 after a three day slide, and the low of that candle sits at 1.0805. You wait for the next candle to close green, then enter just above the hammer high, at 1.0845. The stop goes under the low, at 1.0800. That is 45 pips of risk. On a $5,000 account risking one percent, the risk is $50, which works out at roughly 0.11 lots. Now check the target before you click. If the nearest resistance sits at 1.0930, you are risking 45 pips to make 85, and the trade is worth taking. If resistance sits at 1.0870, you are risking 45 to make 25, and the same beautiful hammer is a bad trade. The pattern never decides that. The distance to the next level does.
no seller anymore
below the support area
Piercing Line
Bullish Harami
Morning Star
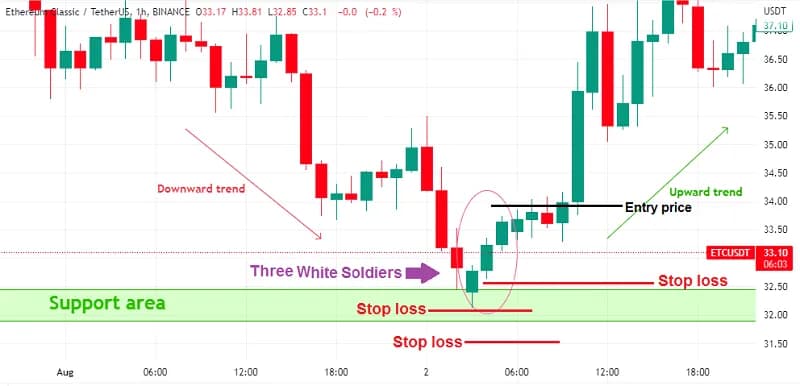
Three White Soldiers
How to trade according to bearish candlesticks?
Shooting Star: this candle appears only after an upward movement. The price runs higher and a Shooting Star forms. The next candle opens below it, which confirms the pattern.
The lowest price of the Shooting Star is a good place to enter the market. Put your stop slightly above the long upper shadow, or above the resistance area, to keep the risk contained. In the example the price goes down as expected.
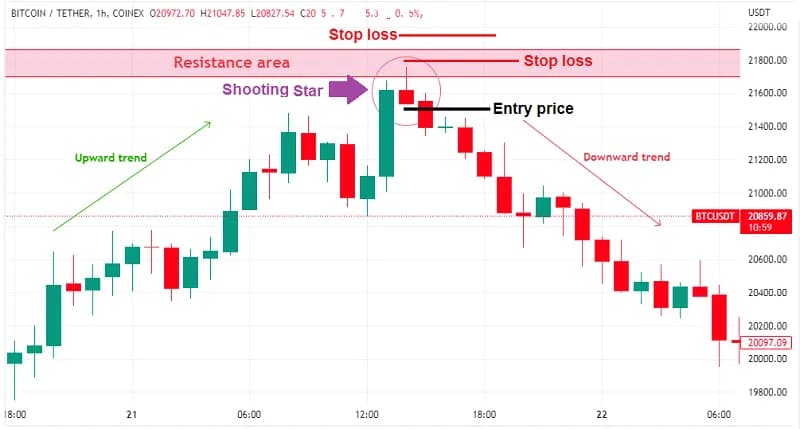
Shooting Star
Hanging Man: The Hanging Man is a Bearish reversal pattern. When the price rises, the formation of a Hanging Man candlestick indicates that sellers are outnumbering buyers.
The long shadow at the bottom shows sellers pushed the price lower during the trading session. Buyers could push the price up, but only near the opening price.
Treat it as an alarm. It says there are no buyers left to push the price higher. The entry price goes above the shadow. The stop loss can sit above the candle, which usually has no upper shadow, or above the resistance area.
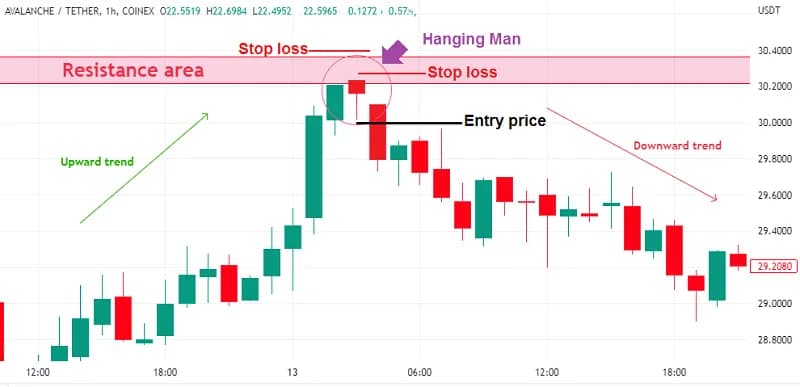
Hanging Man
Bearish Engulfing: This Japanese candlestick pattern occurs when a Bullish candlestick is immediately followed by a Bearish candlestick that completely “covers” it.
So the sellers have outweighed the buyers, and a sharp move down becomes possible. You can enter from the bottom of the second candle once it closes. The stop goes either above that candle or above the resistance area. A gap between the two candles makes the pattern more valid.
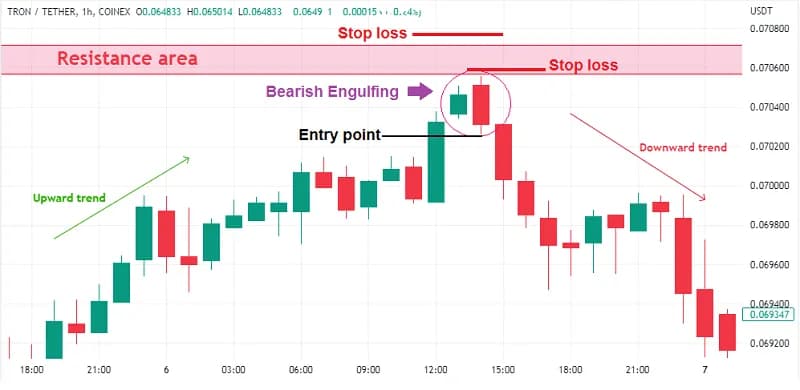
Bearish Engulfing
Dark cloud cover: the pattern starts with a solid Bullish candlestick and a Bullish gap. Then a solid Bearish candle fills that gap. The signal is a coming Bearish reversal.
Wait for the candles to form completely. Your entry can then go below the Bullish or the Bearish candle. The stop loss goes a little higher than the top shadow of the second candle. Volume on that second candle matters too, because it shows the power behind the move.
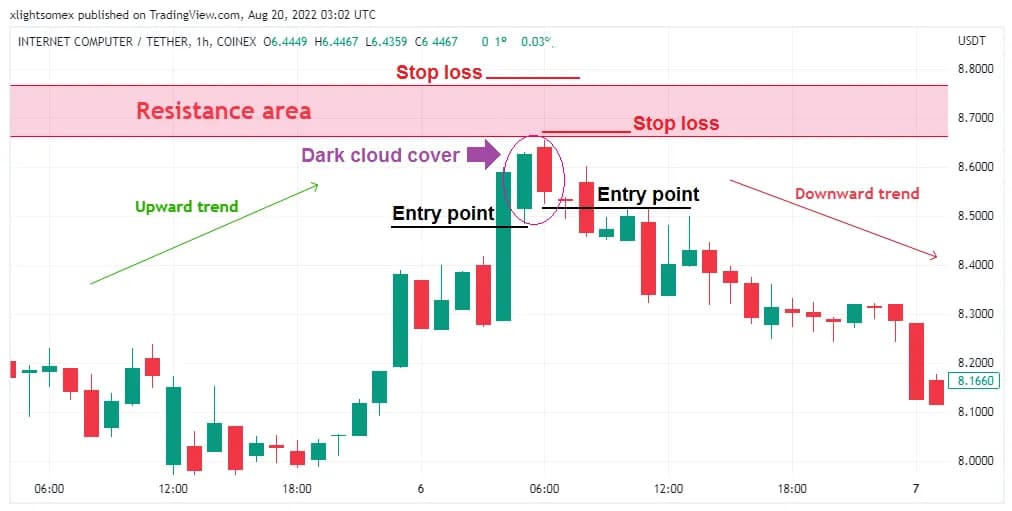
Dark cloud cover
Bearish Harami: This pattern consists of two candles, with the difference that the first candle is green or light and the second candle is red or dark.
The first Bearish Harami candle is green and follows the previous uptrend. The second one has a contrasting color and a small body. It signals volatility and warns of the end of the trend, or even a decline. The child candle is smaller, so it fits inside the body of the mother.
This creates a price gap between the first candle's close and the second candle's open. Our entry goes below the mother or the child candle, once the child has formed. The stop loss sits above either candle, according to our risk management.
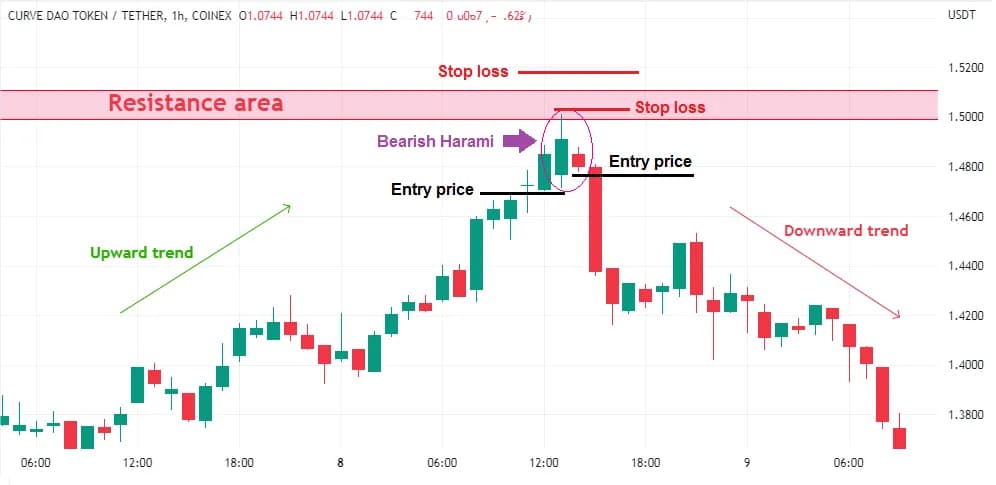
Bearish Harami candle
You have two entry points again. One is slightly lower than the ascending candle (first candle), and the other is lower than the descending candle (smaller candle).
Evening Star: some Japanese candlestick patterns are triple reversal patterns. They mark the end of the current trend and the start of a new one in the opposite direction. The Evening Star and the Morning Star both work this way.
The Evening Star appears at the end of an uptrend near a critical resistance zone. Our entry can go below the third candle. The stop loss sits above the upper shadow of the second candle. As in the other examples, you can also put it above the resistance area.
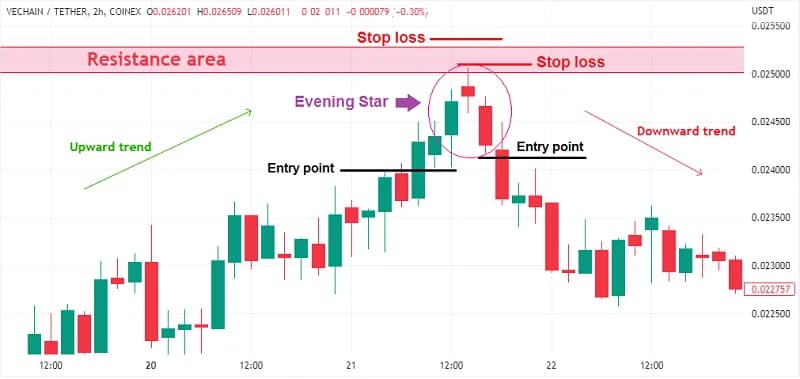
Evening Star
Three Black Crows: The three black crows’ candlestick pattern contradicts the three white soldiers.
You have probably heard that crows bring bad news. In the financial markets, three red descending candles are a bad sign for buyers, and the price usually falls soon after. When those three Bearish candles arrive after a strong uptrend, a reversal is on the agenda.
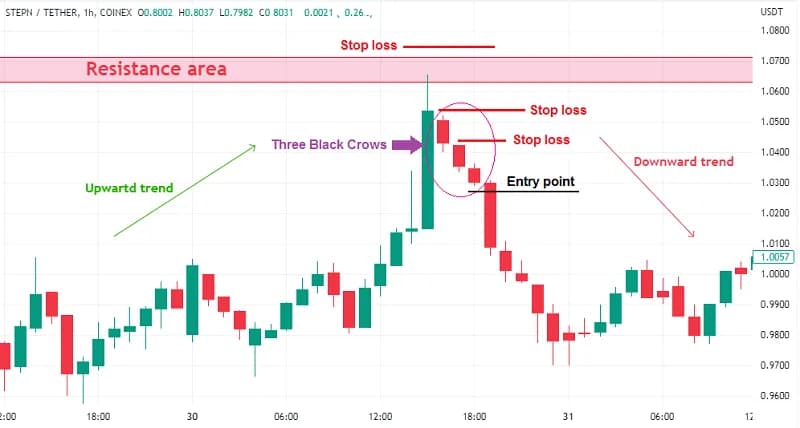
Three Black Crows
Reverse the process of the three white soldiers. Place your entry point slightly below the third candle. The stop goes above that candle or above the second one. You can still use the resistance area to set it.
How to trade according to continuation candlesticks?
Bullish and Bearish Marubozu: now we reach the heavyweight candles. They record a good score on the chart, and their movements are aggressive and intense.
Marubozu candles are more significant than other candles, which indicates their strength. They usually do not have a shadow, which means that the price had a lot of power when these candles formed.
You can enter the position once the Marubozu forms. It is better to wait for the next candle as a confirmation sign. The stop loss goes in the middle of the Marubozu. On Bullish candles you can also set it below them, and on Bearish candles above them.
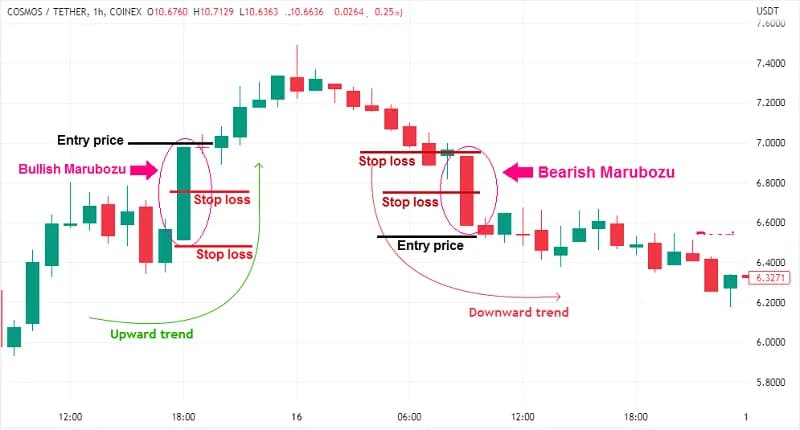
Bullish and Bearish Marubozu
Falling Three Methods: Do you remember riding the slide as a child? Some of them had ridges like a waterfall, taking you up a little and then down on the way down.
In the end you came down, but you went up a little on the way. Slide down a steep slope instead and you fall hard. Some market patterns work like that ridged slide. They lift the price slightly, but the trend still ends downward.
You met the Falling Three Methods pattern in previous articles. It offers an entry, but not at the start of a new trend or the end of an old one. The entry point sits in the middle of the current trend.
Ideally this pattern consists of five candlesticks. To trade it, place your entry below the fifth candle and your stop above the fourth. One check first. Make sure the price is not close to a strong support area, or the trade gets shaky.
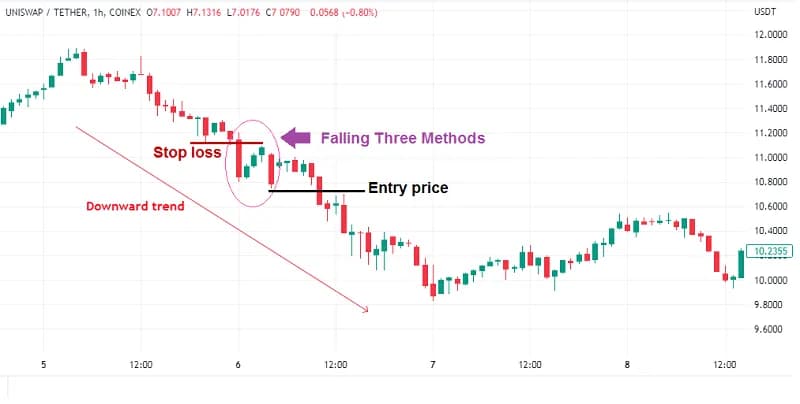
Falling Three Methods
Rising Three Methods: you can enter this one by the close of the last candle in the pattern. The other option is to trade when the price moves above the price of that last candle.
In a hurry, you can look for an entry before the last candle closes. But if that candle fails to complete the pattern, be ready to exit. Also make sure the pattern does not sit below a significant resistance, or the uptrend has nowhere to go.
Check resistance and support levels on long-term charts. It raises the probability of a successful trade. Short shadows on the initial Bullish candlestick, the ones marking the high and low of that period, make the Three Ascending Method more valid. Our entry goes above the fifth candle and our stop below the fourth.
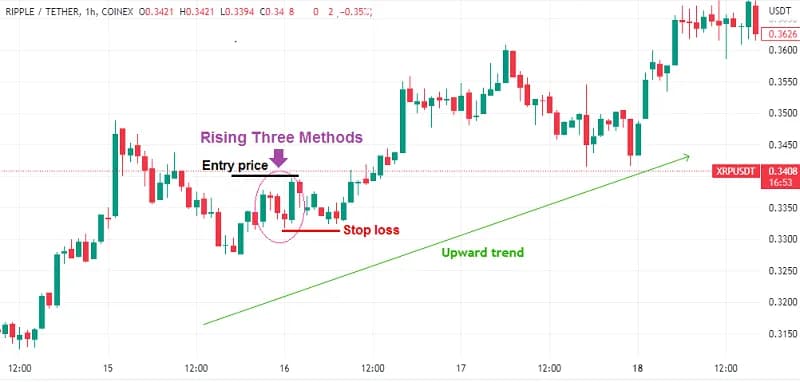
Rising Three Methods
Conclusion
This article showed you how to react to each trend and pattern. For some of them you can enter or place a stop at different points. Which one you use depends on your trading system. Do not make reading price charts too complicated.
Once you find your chart preferences, look for the right amount of information to make good decisions. In other words, do not overcrowd your mind. Keep enough space in your brain to analyze and decide. The right combination is different for every trader.
Like any other pattern or strategy, this takes time and effort to spot in real time. Trade on a demo account first. I recommend at least 50 successful attempts with these patterns before you risk real money. Once you have that data set, you can measure your success. Knowing your win-loss ratio is what gives you confidence.
Slow and steady wins the race. You will be successful by being patient. Where there is a will, there’s a way. I’ll help you through this way, so keep following for more helpful guides.
One last practical note. All of this assumes your fills land where you expect them. Five pips of slippage on a 45 pip stop is eleven percent of your risk gone before the trade even breathes. On a wide spread account, the hammer entry in the example above sits inside the spread rather than above the candle. So before you spend a month backtesting patterns, spend an evening on the boring part. Check the spread, the execution quality and the withdrawal terms where you trade. Our broker reviews are grouped by region, and it is worth ten minutes to compare brokers on those three lines. A pattern is only as good as the fill you get on it.
FAQ
What does it mean to master the art of trading with candlesticks?
It means reading a chart without extra indicators piled on top. You learn what a long body, a short shadow and a rising volume say about the fight between buyers and sellers, then you use that reading to place an entry and a stop. Nothing more exotic than that.
How does candlestick trading work in 2026?
Exactly as it did when the method was written down. Each candle is one round between buyers and sellers, and the shape records who won. What changed is execution: on fast markets a pattern on a one minute chart can be gone before your order fills, so most traders read patterns on higher time frames.
Why do candlestick patterns matter for traders?
Because they mark the moment when control of the price changes hands, and they do it earlier than most lagging indicators. A hammer at a support level tells you sellers ran out of room. That is an entry point and, just as usefully, a natural place to put the stop.
What are the common mistakes?
Trading a pattern in the middle of the chart instead of at a level. Entering on the pattern candle itself rather than waiting for confirmation. Ignoring volume, which is what separates a real reversal from a shrug. And forgetting the old saying that roughly one pattern out of two fails.
How do I apply this in practice?
Pick three or four patterns rather than twenty. Mark support and resistance first, then look for the pattern near those levels. Trade it on a demo account until you have at least fifty logged attempts, and only then work out your win-loss ratio and move to real money.
Find Your Perfect Broker: Explore Our List Now!
Choose the best with our expert-selected options
Find Your Perfect Broker: Explore Our List Now!
Choose the best with our expert-selected options
Discover top binary options brokers tailored to your region. Browse our curated lists by country: