Updated:November 11, 2026

6 min

Double EMA crossover strategy: settings, signals and a live trade
The double EMA crossover strategy reads the trend from two exponential moving averages drawn on the same chart. One line is fast, the other is slow. The point where they cross is the signal. Moving averages are a basic tool of technical analysis, and a platform such as Binomo carries more than 10 types of them, so the first job is picking the right two.

Saqib Iqbal
Author

Updated October 23, 2026
The double EMA crossover strategy reads the trend from two exponential moving averages drawn on the same chart. One line is fast, the other is slow. The point where they cross is the signal. Moving averages are a basic tool of technical analysis, and a platform such as Binomo carries more than 10 types of them, so the first job is picking the right two.
This guide covers the version built on two EMAs. An exponential average weights recent prices more heavily than a simple one. The line turns sooner, and fewer crossings end up being noise.
The exponential moving average reacts to price faster than a simple one. That cuts the lag by roughly 10%. The gap shows up most clearly during high volatility and sharp jumps. The reason sits in the formula: recent candles carry more weight than older ones.
Preliminary preparation
Before the first trade you fix four things: the asset, the timeframe, the expiry, and the periods of the two EMAs. The expiry follows from the timeframe, not the other way round. Pick one asset and stay on it while you learn how its crossings behave.
We will enter the market upon a signal from these indicators in the form of an intersection of two lines. Moving Average settings:
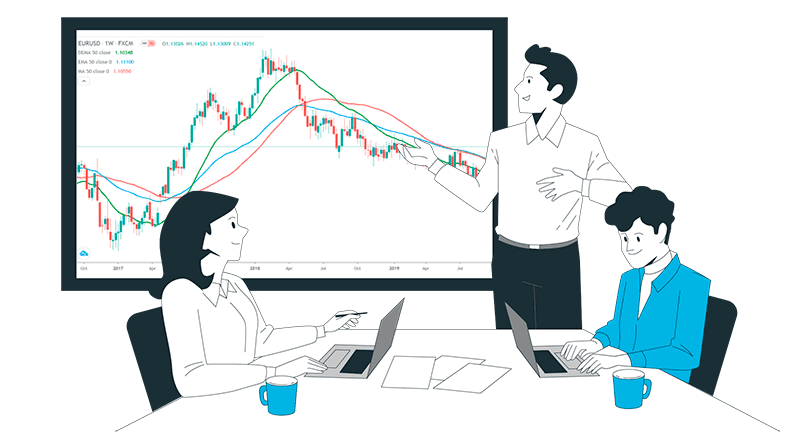
The Doube EMA Crossover Strategy
slow line: period 22, colour blue, type exponential
fast line: period 8, colour red, type exponential
The remaining parameters should be left at the default values.
Signal for an up option
The order of the two lines tells you which trend is running. Red (fast) on top means the market is heading up. That is the state you want to see before an up option.
When price turns the other way, the blue (slow) line ends up on top and the red one heads down. Watch the gap between the EMAs. The wider it is, the stronger the trend that is running.
The best entry is the moment the trend starts. That is the crossing itself, when the slow line breaks through the fast one from underneath. Open the trade there, betting on a rising price.
Signal for a down option
A down trade belongs at the very start of a falling trend. The signal is the same crossing, only reversed: the fast red line cuts through the slow one from above.
Expiry should cover two to four candles. On a 15-second or 30-second chart that means a fixed 1-minute contract. Longer expiries give the trend time to fade before the option closes.

Signal for options “Up”
A live trade on the double EMA
For this article we ran the strategy on a live account and recorded the whole process, entry included.
We had $275 in our account, which was a real account, rather than a training (demo) account. At the time of writing this article, it was a weekend, so only one asset was available - CRYPTO IDX. This is what we traded.
We set the terminal up to the rules above and waited. The lines crossed downwards, which marked the start of a falling trend, and we bought a Down option for $10.
The screenshot was taken about a minute after the purchase, with 27 seconds left before expiry, so it shows how the price behaved once the trade was open.
The trend ran its usual length for this asset, and the trade closed in profit at almost $8. CRYPTO IDX pays well, usually 79% or more. That is why it stays tradable at weekends, when the interbank currency market is shut.
Money management and other nuances
Money management is the set of rules that keeps a deposit alive on short-term markets. These markets punish position size long before they punish weak analysis.
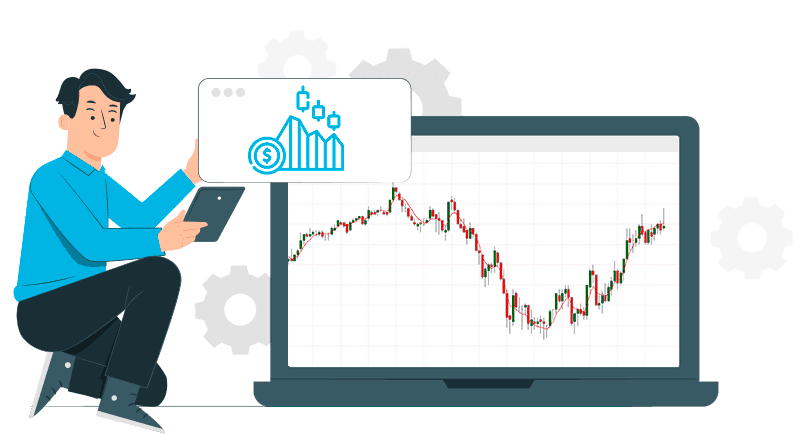
An example of trading the “Double EMA”
The full system takes time to learn, but two numbers matter from the first trade. Money management forbids putting more than 4 to 5% of the account into a single position. That limit does more for survival than any indicator setting.
No signal is 100% reliable, or even 90%. The best tools on the market top out near 75%. What separates a profitable trader is reading the context: the small signs that do not show up in the indicator itself. Candlestick patterns next to the EMA crossing are the usual pairing.
Volatility is the other variable. The wider the gap between the two lines before the reversal, the better the odds that the option closes in profit. In a dead flat market the crossing is worth little. General Risk Warning: Binary options trading carries a high level of risk and can result in the loss of all your funds.
Common mistakes with the double EMA
Three errors spoil this setup more often than a bad market. The first is trading every crossing. On a flat chart the lines tangle and every touch looks like a signal, so wait until the two EMAs clearly separate. The second is an expiry that ignores the timeframe: two to four candles is the working range. The third is position size. Check the payout at your broker before you copy these settings, because a 60% payout ruins the maths of a 75% win rate.

Money management and other nuances
Bottom line
The double EMA crossover is a trend entry, not a risk filter. It works when the market moves and fails when it drifts sideways. Start on a demo account, log 30 to 50 signals, and count how many closed in profit before you risk real money. If your terminal will not let you set the EMA period by hand, compare regulated brokers and move to one that does.
FAQ
What is the double EMA crossover strategy?
It is a trend entry built on two exponential moving averages, periods 8 and 22. When the fast line crosses the slow one, the strategy treats it as the start of a new move and opens a trade in that direction.
How does the double EMA crossover work in 2026?
The rules have not changed: cross upwards means an up option, cross downwards means a down option, expiry two to four candles. What changed is the choice of assets and payouts, so check the payout before sizing a trade.
How do I get started with this strategy?
Add two exponential moving averages, set periods 8 and 22, leave the rest at default. Pick one asset and one timeframe, then watch the crossings for a session without trading. Only then risk a small live position.
Is the double EMA crossover suitable for beginners?
Yes, the signal is easy to read. The hard part is money management, and that is where beginners lose. Keep each trade under 4 to 5% of the account and accept that even a good signal is right about 70 to 75% of the time.
Find Your Perfect Broker: Explore Our List Now!
Choose the best with our expert-selected options

Find Your Perfect Broker: Explore Our List Now!
Choose the best with our expert-selected options
Discover top binary options brokers tailored to your region. Browse our curated lists by country: