Updated:November 11, 2026

5 min

Technical Analysis: Principles and Methods
Technical analysis studies price and volume history to anticipate future movement. It rests on a specific claim about markets, and it is worth understanding both the claim and the objection to it. Updated September 2026.

Pejman Zwin
Author

Updated October 23, 2026
Technical analysis studies price and volume history to anticipate future movement. It rests on a specific claim about markets, and it is worth understanding both the claim and the objection to it. Updated September 2026.
Where it came from
The earliest documented principles are attributed to Munehisa Homma, an 18th-century Japanese rice trader, whose work on price behaviour preceded Western chart analysis by well over a century.
Charles Dow founded the modern discipline. A journalist and co-founder of Dow Jones and Company, he published observations on market behaviour in bulletins distributed to subscribers, and those observations became Dow Theory.
By recording prices and calculating averages, analysts identified that price behaviour repeated in recognisable ways. In 1948 Robert D. Edwards and John Magee published Technical Analysis of Stock Trends, which formalised the field and remains a standard reference. Indicators such as moving averages followed from that systematisation.
What technical analysis claims
The definitions vary but converge on the same idea:
-
Studying time and price relationships to anticipate future movement
-
Examining a chart's past behaviour to project its likely continuation
-
Identifying repeating patterns in price and volume
-
Applying mathematical formulas to price data to generate signals
The contrast is with fundamental analysis, which judges an asset by its intrinsic worth: earnings, assets, competitive position and economic conditions. A fundamental analyst asks what a company is worth. A technical analyst asks only what the price is doing.
The objection worth knowing
The efficient market hypothesis holds that prices already reflect all available information, which would mean past price patterns cannot predict future ones. Under that view, apparent patterns are artefacts found retrospectively in random data.
Academic evidence is mixed rather than settled. Some studies find modest predictive value in certain technical approaches, particularly momentum; others find results indistinguishable from chance once transaction costs are deducted.
There is also a self-fulfilling element, and it is not a trivial one: when enough participants place orders at the same identified support level, that level holds partly because they expected it to. Whether that makes technical analysis valid or merely self-referential is a genuine debate, and a reader should know it exists rather than treating the discipline as established fact.
Dow's principles
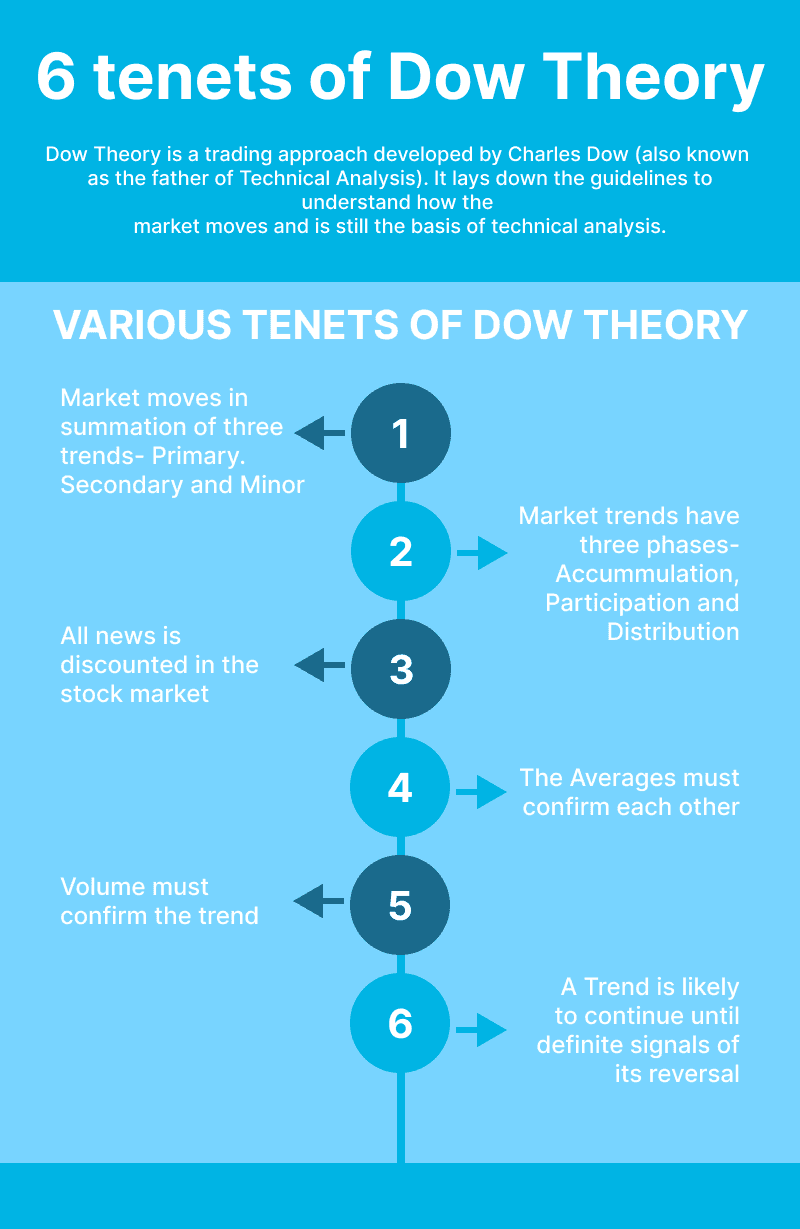
Six principles form the foundation, the first being the structure of trends.
-
The primary trend: the main market movement, lasting a year or more
-
The intermediate trend: lasting from three weeks to a few months, often running counter to the primary
-
The minor trend: lasting days to weeks, the least reliable of the three
Each primary trend has three phases. In an upward trend these are accumulation, public participation and excess. In a downward trend they are distribution, public participation and panic.
The remaining principles: prices discount all known information; the averages must confirm each other; volume confirms the trend; and a trend remains in effect until a clear reversal signal appears.
The confirmation principle came from Dow's construction of two averages, one for industrial production and one for transportation. His reasoning was that if goods are being produced, the companies moving them should benefit too, so a move in one average unconfirmed by the other was suspect.
The main branches
Candlestick analysis originated in Japan more than a century before Western bar charts. Each candle encodes the open, high, low and close, with named formations such as the Hammer and Hanging Man describing specific configurations.
Chart patterns are geometric formations: support and resistance levels, trend lines and channels, double tops and bottoms, head and shoulders, triangles and flags.
Indicators apply mathematical formulas to price data. Moving averages, Bollinger Bands, Stochastic and the Relative Strength Index are among the most widely used.
Fibonacci tools draw retracement and extension levels from the Fibonacci sequence, with harmonic patterns forming a subdiscipline built on those ratios.
Elliott Wave Theory, developed by Ralph Nelson Elliott, describes price as moving in repeating wave structures, alternating impulsive waves in the direction of the trend with corrective waves against it.
How to approach it
-
Learn one branch properly before adding another, most traders use too many indicators rather than too few
-
Test any method across a sample large enough to include a losing run
-
Include transaction costs in any assessment, they eliminate many marginal edges
-
Treat confluence between independent methods as meaningful, and a single signal as weak
-
Remember that risk management determines survival, while analysis only determines entry
See related trading guides and compare charting platforms in our forex brokers section.
Technical analysis: frequently asked questions
What is technical analysis?
The study of historical price and volume to anticipate future movement, in contrast to fundamental analysis which assesses an asset's intrinsic worth.
Basic principles of Technical Analysis

The definition of Technical Analysis

The history of Technical Analysis
Who founded it?
Charles Dow founded the modern discipline, though documented principles trace to Munehisa Homma in 18th-century Japan.
What are Dow's trend types?
Primary trends lasting a year or more, intermediate trends of three weeks to a few months, and minor trends of days to weeks.
Does technical analysis actually work?
Academic evidence is mixed. Some studies find modest predictive value, others find results indistinguishable from chance after transaction costs.
What are the main branches?
Candlestick analysis, chart patterns, mathematical indicators, Fibonacci tools and Elliott Wave Theory.

What are the main contents of Technical Analysis?
Where should a beginner start?
With one branch learned properly rather than several superficially, and with risk management, which determines survival regardless of the analysis used.
Find Your Perfect Broker: Explore Our List Now!
Choose the best with our expert-selected options


Find Your Perfect Broker: Explore Our List Now!
Choose the best with our expert-selected options
Discover top binary options brokers tailored to your region. Browse our curated lists by country: