Updated:November 11, 2026

11 min

How to use the economic calendar for binary options trading
Knowing how to use the economic calendar is the difference between being surprised by a price move and being ready for it. An economic calendar is essential for any trader wishing to have an accurate gauge of the market’s direction. Economic calendars highlight all the scheduled economic data releases that may affect market prices, with events categorized by country and potential impact.

Cory Mitchell
Author
Updated October 23, 2026
Knowing how to use the economic calendar is the difference between being surprised by a price move and being ready for it. An economic calendar is essential for any trader wishing to have an accurate gauge of the market’s direction. Economic calendars highlight all the scheduled economic data releases that may affect market prices, with events categorized by country and potential impact.
This vital information helps you determine when large price moves in related assets are likely to occur. You can then determine if they wish to enter trades before the event, close trades before the event, or trade the price moves that follow.
Understanding the economic calendar for binary options
“The secret to being successful from a trading perspective is to have an indefatigable and an undying and unquenchable thirst for information and knowledge.” - Paul Tudor Jones
Asset prices react to new information. If inflation is increasing, this affects what assets traders, investors, institutions, and hedge funds may want to own or sell.
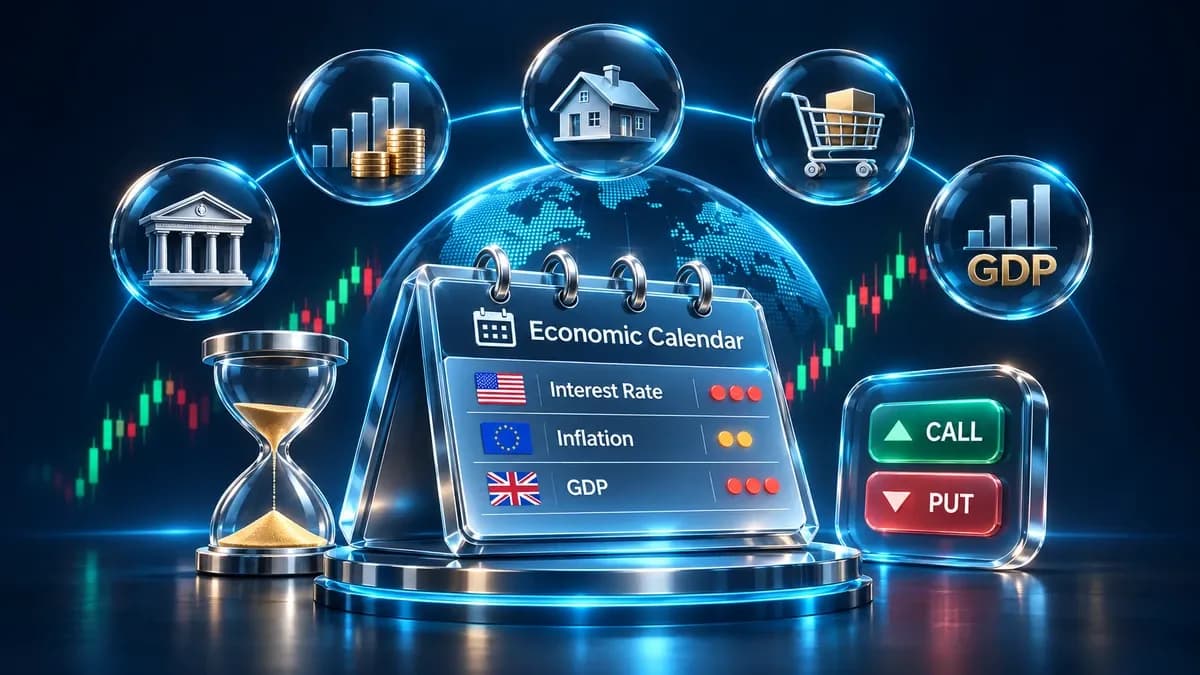
Economic calendars aggregate information released by organizations and government agencies at regularly scheduled times throughout the week, month, and year. There are many different types of relevant economic events, such as interest rate announcements, inflation data, housing data, price of goods, and economic indicators such as GDP tracking.
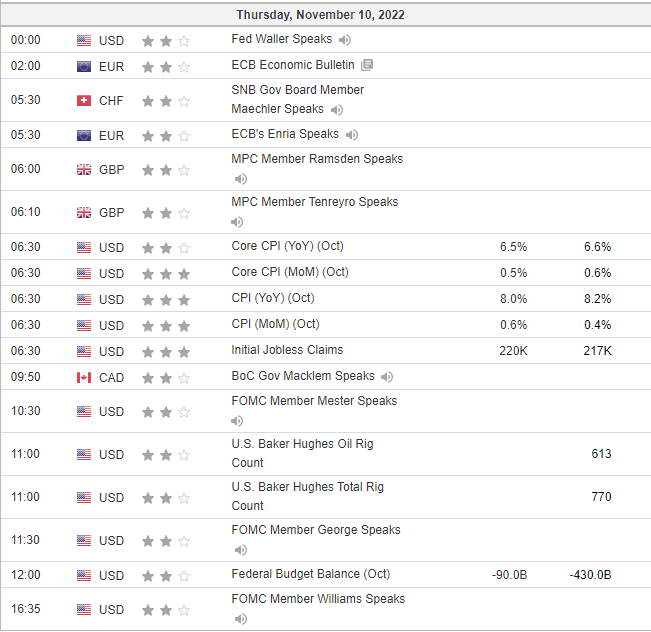
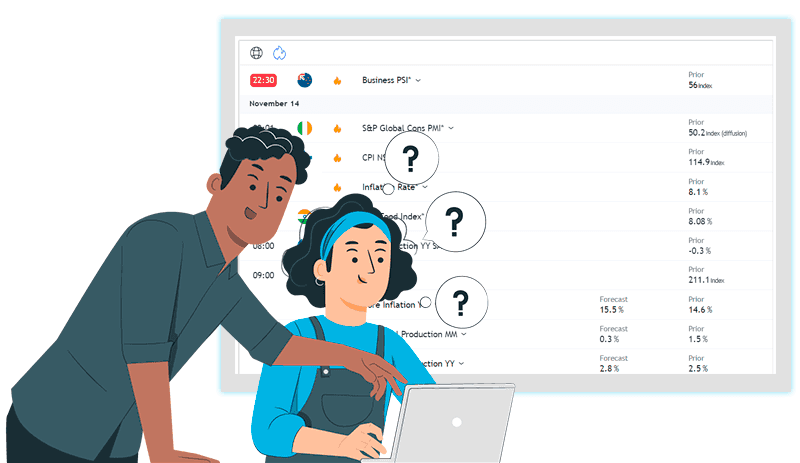
By viewing the economic calendar, binary options traders can see which countries have economic data releases on a given day. The economic calendar provides the precise day and time of the data is released so traders know in advance and can prepare. Here’s an example of an economic calendar on a particular day:
You only need to review the economic calendar events that affect the market you are trading, and which will have a significant impact on prices. Most economic calendars tell you the expected impact of an event by ranking the events as low, medium, or high impact.
How to use an economic calendar when trading binary options
The Investing.com economic calendar shown above gives three stars to events that are likely to cause large price moves. Two stars represent medium-impact news, which may cause large price moves. One star events are unlikely to cause large price moves.
Understanding the Economic Calendar for Binary Options
Traders use economic calendars in different ways. Some traders stop trading just before the news is released, then trade on the movement that follows. Other traders develop predictions of what the data will reveal and how it will affect price. They then place trades before the news to potentially profit from the news and ensuing price moves if they are correct.
News is only likely to affect markets associated with that news; for example, Canadian housing data is unlikely to affect the US stock market, but it will affect the USD/CAD forex pair. British GDP data that affects the UK stock market may not affect the US stock market, but it will affect all GDP-related currency pairs.
Therefore, if you trade US markets, pay attention to US economic data releases. If you trade European markets, pay attention to European economic data released. If you trade forex, pay attention to the economic news in both countries/zones in your currency pair.
Understanding the Economic Calendar for Binary Options
For example, if you day trade the EUR/USD, monitor high-impact European and US economic data on the economic calendar. If you want to be thorough, you could also monitor medium impact news as it may result in significant price moves. Many binary options brokers publish their own calendar inside the trading platform. If yours does not, the one on Investing.com works well.
Is leverage dangerous when you trade around scheduled news? It can be, but it can also be beneficial if you trade in a risk-controlled way. Using too much leverage will eventually result in a big loss if risk isn’t controlled. To prevent this, use a stop loss on each trade that exits the trade when a small percent of your personal capital is lost.
Not using a stop loss is a common mistake. This way, even with using leverage or margin, you are only risking a small percentage of your own capital.
What do the numbers on an economic calendar mean?
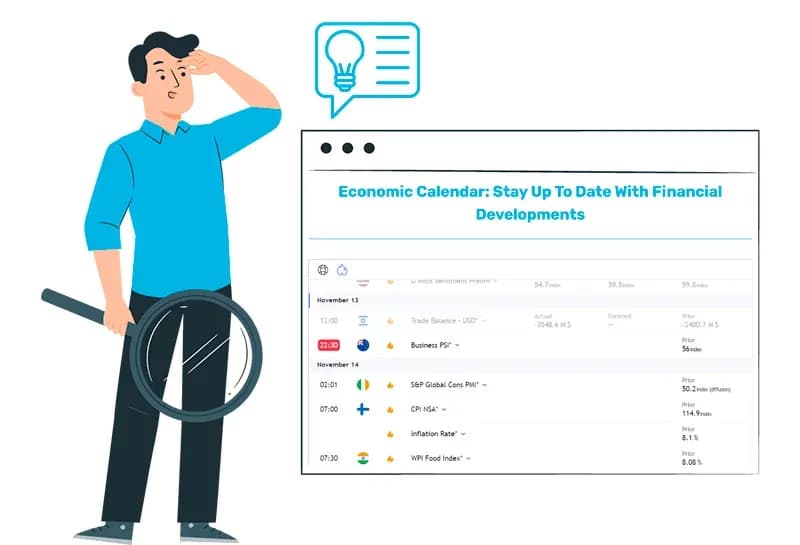
The economic calendar provides the date, time, country, and name of the economic data release. Most will also show what the expected value is (based on professional analyst predictions), what the actual number is once the data is released, and what the previous value was.
How to Use an Economic Calendar When Trading Binary Options
These figures can help you assess how far the price may move and in what direction. The value itself isn’t so important. Rather, it is the value relative to the forecasted amount that you should focus on.
Assume you buy stocks because inflation is low and you expect stocks to rise. Analysts are predicting 1% inflation. The data comes in at 3%. That’s a big difference. Now, you personally may not care because you trade a strategy based on technical analysis, but a lot of investors and businesses do.
In that situation, investors may not be so sure if stock prices will rise because inflation is higher. Corporate costs are rising and could cut into corporate profits if companies are unable to sell as much as they raise their own prices to consumers to compensate.
The massive difference between the expected value and the actual value is likely to cause big price moves. If the expected value was 1% and the actual value is 1%, the reaction to the news is likely to be more muted since the data came in as expected.
This is just an example, but the same concept applies to all economic data. If the number released is close to expectations, the ensuing price move is usually less than if the actual number is very different from the forecasted number. The current number versus the previous values shows which way the data is trending.
Trading around the news events on an economic calendar
Scheduled economic news releases, especially the high-impact events, often cause sharp price moves in the minutes following the news release. This effect may last hours or even days in some cases.
What Do The Numbers on an Economic Calendar Mean?
Keep in mind, though, that the news is not the only factor that affects prices. Many traders rely on their own methods, independent of current market news. However, keeping your finger on the pulse of economic events can be a profitable dimension to add to your trading strategy.
As price moves, it creates technical patterns, crosses through moving averages, and these factors bring in other traders. Other factors start becoming more relevant hours, and even minutes, after the data is released. For short-term traders, after the news is released, it’s key to focus on price patterns and trend trades that develop and trade those.
Focusing too much on the news, and trying to predict where it will lead price isn’t always wise since other factors will start affecting the price more and more over time. A strangle binary option strategy can be employed profitably around high-impact news. Learn that strategy to take advantage.
Key economic calendar events to watch for
Any high-impact news is noteworthy, but some high-impact news has more weight than others. Typically, anything related to interest rates or inflation is going to affect the markets a lot.
Trading Around the News Events on an Economic Calendar
There are quite a few events related to interest rates and inflation. Here are a few to pay special attention to.
Interest rate announcements
Central banks around the world set their interest rates for the country at regular intervals. The meetings are scheduled in advance, and then the rate which they decide (along with a press conference to follow) is released at a specific time. These are some of the biggest market-moving events, especially if the interest rate they decide on is different from what was predicted by analysts.
CPI and PPI
The Consumer Price Index and the Producer Price index provide information on rising or falling consumer and producer costs in the US. This is information that central bankers use to make interest rate decisions. Look for similar events in other countries if you are trading markets outside the US.
Gross domestic product
GDP is the goods and services that a country produces within a given time frame. This indicates the health of a country’s current economy. This will in turn affect money in the country, spending, inflation, and thus can have a large impact on financial market prices.
Employment data
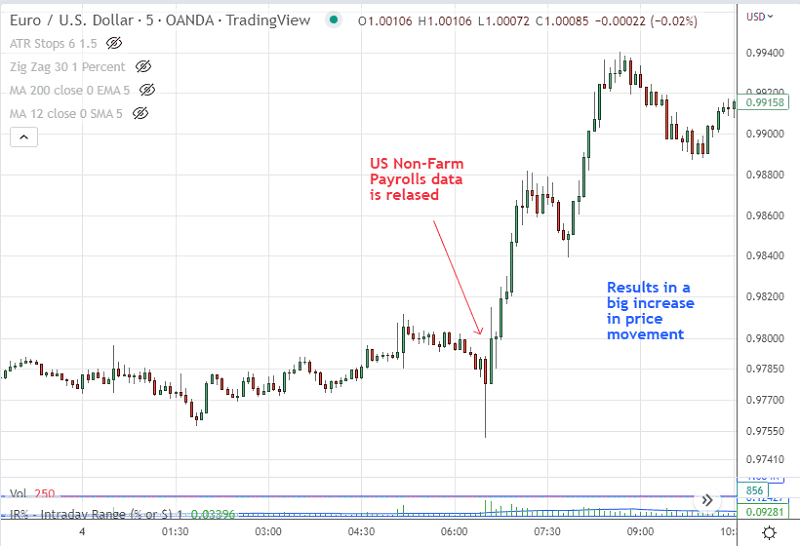
The unemployment rate, and how many workers a county’s workforce gained or lost, can cause large price swings.
In the US, the big monthly event is called the Non-Farm Payroll and is released the first Friday of the month. Other countries release similar figures under various employment-related names.
A worked example: one CPI release, start to finish
Here is how the pieces fit together on a single day. The figures are illustrative. The sequence is what actually happens. The calendar shows US CPI at 13:30 GMT with a three-star rating. Forecast 2.9%, previous month 3.1%. You trade EUR/USD, so this release sits on both sides of your pair.
Employment Data
Thirty minutes before the print you stop opening positions. Spreads widen ahead of a big release and quotes get thin. At 13:30 the actual number lands at 3.4%, well above forecast. That gap between expected and actual is what moves price, not the headline figure on its own. The dollar strengthens and EUR/USD drops.
The first minute is noise. Let it pass. Then look at the chart: a clean break below the pre-release range, a retest that holds, price on the wrong side of the moving average you normally watch. That is the entry signal, not the number itself. Size the trade so a loss costs a small fixed percentage of your account.
Bottom line
The economic calendar predicts nothing. What it does is tell you when the market is likely to move and which market will feel it. That alone removes most of the guesswork about timing. Filter the calendar down to the events that touch your instrument. Watch the gap between forecast and actual. Keep a stop on every position. If your platform lacks a usable calendar or a sensible range of expiries, our broker comparison shows what is on offer in 2026.
FAQ
What is an economic calendar?
It is a schedule of data releases published by governments and statistical agencies: interest rate decisions, inflation prints, GDP, housing and employment figures. Each entry lists the date, time, country, the forecast, the previous value and the actual number once it is out. Most calendars also rank the expected impact.
How do I use the economic calendar in 2026?
Filter it to the countries behind the instrument you trade, then keep only the high-impact events. For EUR/USD that means European and US releases. Note the exact release time, avoid opening positions in the minutes before it, and trade the price action that follows once the first spike settles.
What do the star ratings mean?
On the Investing.com calendar three stars mark events likely to cause large price moves, two stars mark medium-impact news that may cause them, and one star events rarely move price at all. The rating is a filter, not a forecast: a two-star release can still surprise if the number misses expectations badly.
What are the most common mistakes?
Trading every event instead of the ones tied to your instrument. Watching the raw number rather than its distance from forecast. Entering during the first chaotic minute after a release. And the biggest one, skipping the stop loss, which turns a single bad print into a serious loss.
Is the economic calendar suitable for beginners?
Yes, and it helps immediately. A beginner can use it defensively at first: check which releases are due, then stay out of the market around the three-star ones. Trading the reaction itself takes more practice and strict risk control.
Find Your Perfect Broker: Explore Our List Now!
Choose the best with our expert-selected options
Find Your Perfect Broker: Explore Our List Now!
Choose the best with our expert-selected options
Discover top binary options brokers tailored to your region. Browse our curated lists by country: